Results
| Country: | U.S.A.
| | Station: | TANACROSS AK | | River: | TANANA R | | Area: | 22143.19 | | Lat: | 63.39 | | Lon: | -143.74 | | Source: | USGS | | PointID: | 15476000 | | Area Units: | km2 | | Discharge Units: | m3/sec | | Starting Year: | 1961 | | Ending Year: | 1982 | | Total Years: | 22 | | Total Usable Years: | 21 | |
| |
| Year | Jan | Feb | Mar | Apr | May | Jun | Jul | Aug | Sep | Oct | Nov | Dec | Avg Annual |
|---|
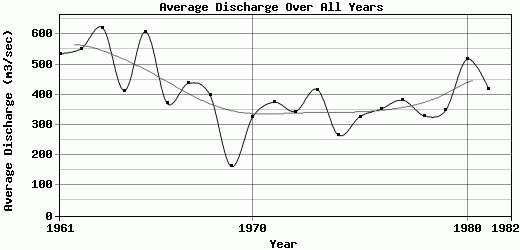
| 1961 | 19.82 | 13.59 | 9.06 | 8.21 | 1306.51 | 1169.3 | 1032.47 | 1406.9 | 881.41 | 425.85 | 101.94 | 50.97 | 535.5 |
| 1962 | 36.81 | 28.32 | 22.37 | 23.22 | 1078.33 | 2747.5 | 609.09 | 659.6 | 1100.21 | 227.54 | 65.13 | 27 | 552.09 |
| 1963 | 15.01 | 11.89 | 11.33 | 11.89 | 1208.04 | 1680.52 | 1180.82 | 2117.38 | 665.64 | 408.5 | 110.44 | 30.88 | 621.03 |
| 1964 | 22.94 | 18.69 | 15.01 | 13.73 | 21.28 | 2668.78 | 474.45 | 474.72 | 852.25 | 298.97 | 77.4 | 26.05 | 413.69 |
| 1965 | 17.56 | 13.88 | 12.18 | 13.88 | 102.81 | 2470.66 | 913.18 | 1361.41 | 1363.75 | 838.37 | 127.43 | 56.63 | 607.65 |
| 1966 | 35.4 | 22.65 | 16.99 | 11.33 | 906.6 | 1609.26 | 613.93 | 447.68 | 444.67 | 227.3 | 79.29 | 39.64 | 371.23 |
| 1967 | 22.65 | 13.59 | 7.93 | 11.33 | 1002.88 | 1945.85 | 630.19 | 798.63 | 482.62 | 212.52 | 82.87 | 42.93 | 437.83 |
| 1968 | 27.91 | 22.26 | 21.24 | 21.24 | 668.83 | 2880.12 | 553.73 | 348.8 | 148.29 | 62.39 | 20.2 | 10.82 | 398.82 |
| 1969 | 8.5 | 7.08 | 7.08 | 8.21 | 517.88 | 355.57 | 156.15 | 511.44 | 244.75 | 95.82 | 23.88 | 11.2 | 162.3 |
| 1970 | 8.68 | 8.03 | 7.52 | 19.94 | 1001.78 | 759.08 | 691.76 | 806.76 | 417.86 | 117.65 | 52.01 | 29.5 | 326.71 |
| 1971 | 20.19 | 16.33 | 15.19 | 18.06 | 1494.95 | 1698.64 | 350.17 | 383.24 | 247.96 | 161.68 | 60.88 | 30.05 | 374.78 |
| 1972 | 19.73 | 14.21 | 11.19 | 10.85 | 935.56 | 1465.59 | 322.72 | 586.71 | 535.47 | 123.96 | 62.96 | 38.46 | 343.95 |
| 1973 | 25.76 | 18.86 | 15.48 | 13.45 | 862.71 | 1487.21 | 508.88 | 1178.35 | 549.63 | 212.47 | 80.61 | 50.88 | 417.02 |
| 1974 | 31.1 | 19.57 | 12.97 | 10.67 | 820.28 | 789.76 | 298.82 | 583.7 | 356.65 | 183.7 | 61.26 | 18.77 | 265.6 |
| 1975 | 12.56 | 11.33 | 11.33 | 11.33 | 968.81 | 1310.13 | 416.81 | 316.01 | 588.43 | 236.22 | 32.22 | 14.56 | 327.48 |
| 1976 | 11.7 | 11.33 | 11.33 | 13.13 | 862.39 | 1281.06 | 626.54 | 504.13 | 421.83 | 329.57 | 110.15 | 52.07 | 352.94 |
| 1977 | 29.29 | 21.69 | 19.82 | 20.8 | 687.35 | 2080.83 | 327.69 | 370.26 | 613.82 | 305.82 | 66.17 | 41.65 | 382.1 |
| 1978 | 27.51 | 19.01 | 14.41 | 30.3 | 1045.08 | 1258.41 | 848.51 | 246.16 | 248.27 | 107.2 | 68.43 | 45.95 | 329.94 |
| 1979 | 31.06 | 19.82 | 18.01 | 15.26 | 1426.45 | 930.31 | 543.6 | 484.13 | 387.86 | 211.46 | 68.43 | 42.75 | 348.26 |
| 1980 | 36.81 | 33.98 | 32.52 | 34.55 | 1369.36 | 1661.26 | 891.89 | 726.1 | 506.23 | 569.45 | 234.09 | 108.43 | 517.06 |
| 1981 | 38.73 | 29.83 | 25.44 | 23.22 | 1266.34 | 752.67 | 1094.77 | 1282.03 | 342.92 | 94.5 | 50.03 | 39.55 | 420 |
| 1982 | -9999 | -9999 | -9999 | -9999 | -9999 | -9999 | -9999 | -9999 | -9999 | -9999 | -9999 | -9999 | -9999 |
| |
|
|
|
|
|
|
|
|
|
|
|
|
|
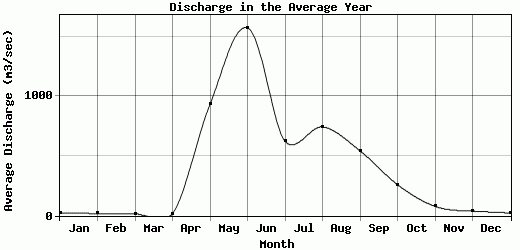
| Avg | 23.8 | 17.9 | 15.16 | 16.41 | 931.15 | 1571.55 | 623.15 | 742.58 | 542.88 | 259.57 | 77.9 | 38.51 | 405.05 |
| |
|
|
|
|
|
|
|
|
|
|
|
|
|
| Std Dev | 9.17 |
6.83 |
6.24 |
6.91 |
375.86 |
683.38 |
274.07 |
460.13 |
291.06 |
178.46 |
43.98 |
20.46 |
108.86 |
| |
|
|
|
|
|
|
|
|
|
|
|
|
|
| | Jan | Feb | Mar | Apr | May | Jun | Jul | Aug | Sep | Oct | Nov | Dec | Avg Annual |
Click here for this table in tab-delimited format.
Tab-delimited format will open in most table browsing software, i.e. Excel, etc.
View this station on the map.
Return to start.