Results
| Country: | India
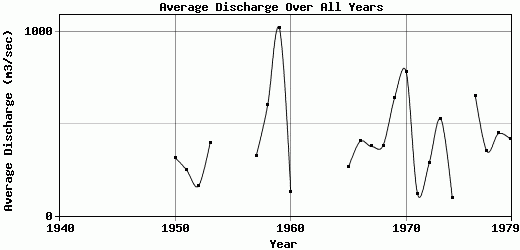
| | Station: | Kathore | | River: | Tapi | | Area: | 61575 km2 | | Lat: | 21.28 | | Lon: | 72.95 | | Source: | RivDIS | | PointID: | 845 | | Area Units: | km2 | | Discharge Units: | m3/sec | | Starting Year: | 1940 | | Ending Year: | 1979 | | Total Years: | 40 | | Total Usable Years: | 28 | |
| |
| Year | Jan | Feb | Mar | Apr | May | Jun | Jul | Aug | Sep | Oct | Nov | Dec | Avg Annual |
|---|
| 1940 | -9999 | -9999 | -9999 | -9999 | -9999 | 475 | 1569 | 2671 | 157 | 629 | -9999 | -9999 | -9999 |
| 1941 | -9999 | -9999 | -9999 | -9999 | -9999 | 46 | 3259 | 977 | 401 | 91 | -9999 | -9999 | -9999 |
| 1942 | -9999 | -9999 | -9999 | -9999 | -9999 | 156 | 1386 | 3652 | 2357 | 244 | -9999 | -9999 | -9999 |
| 1943 | -9999 | -9999 | -9999 | -9999 | -9999 | 523 | 801 | -9999 | -9999 | -9999 | -9999 | -9999 | -9999 |
| 1944 | -9999 | -9999 | -9999 | -9999 | -9999 | 30 | 2205 | 9830 | 1577 | 398 | 279 | -9999 | -9999 |
| 1945 | -9999 | -9999 | -9999 | -9999 | -9999 | 120 | 1252 | 1761 | 1130 | 657 | 116 | -9999 | -9999 |
| 1946 | -9999 | -9999 | -9999 | -9999 | 70 | 514 | 1513 | 3221 | 1507 | 262 | 435 | -9999 | -9999 |
| 1947 | -9999 | -9999 | -9999 | -9999 | -9999 | -9999 | 435 | 1073 | 2082 | 325 | 110 | 109 | -9999 |
| 1948 | -9999 | -9999 | -9999 | -9999 | -9999 | 691 | 1263 | 1743 | 1928 | 462 | 702 | 181 | -9999 |
| 1949 | -9999 | -9999 | -9999 | -9999 | -9999 | 134 | 1556 | 1058 | 4879 | 2124 | 338 | 136 | -9999 |
| 1950 | 110 | 84 | 67 | 47 | 28 | 39 | 647 | 851 | 1474 | 291 | 81 | 55 | 314.5 |
| 1951 | 52 | 35 | 27 | 21 | 17 | 199 | 788 | 1061 | 339 | 336 | 49 | 31 | 246.25 |
| 1952 | 24 | 20 | 14 | 10 | 8 | 205 | 571 | 781 | 167 | 91 | 19 | 13 | 160.25 |
| 1953 | 13 | 11 | 9 | 6 | 5 | 389 | 662 | 2331 | 945 | 284 | 52 | 23 | 394.17 |
| 1954 | -9999 | -9999 | -9999 | -9999 | -9999 | -9999 | -9999 | -9999 | -9999 | -9999 | -9999 | -9999 | -9999 |
| 1955 | -9999 | -9999 | -9999 | -9999 | -9999 | -9999 | -9999 | -9999 | -9999 | -9999 | -9999 | -9999 | -9999 |
| 1956 | -9999 | -9999 | -9999 | -9999 | -9999 | 1282 | 2297 | 2346 | 1302 | 1321 | 622 | 303 | -9999 |
| 1957 | 101 | 137 | 116 | 97 | 62 | 486 | 653 | 1218 | 638 | 238 | 87 | 50 | 323.58 |
| 1958 | 41 | 41 | 22 | 17 | 22 | 78 | 1621 | 2195 | 2393 | 510 | 123 | 154 | 601.42 |
| 1959 | 21 | 84 | 78 | 11 | 21 | 88 | 1869 | 2103 | 6755 | 980 | 140 | 140 | 1024.17 |
| 1960 | 70 | 42 | 19 | 21 | 26 | 184 | 310 | 296 | 203 | 134 | 36 | 211 | 129.33 |
| 1961 | -9999 | -9999 | -9999 | -9999 | -9999 | -9999 | -9999 | -9999 | -9999 | -9999 | -9999 | -9999 | -9999 |
| 1962 | -9999 | -9999 | -9999 | -9999 | -9999 | -9999 | -9999 | -9999 | -9999 | -9999 | -9999 | -9999 | -9999 |
| 1963 | -9999 | -9999 | -9999 | -9999 | -9999 | -9999 | -9999 | -9999 | -9999 | -9999 | -9999 | -9999 | -9999 |
| 1964 | -9999 | -9999 | -9999 | -9999 | -9999 | -9999 | -9999 | -9999 | -9999 | -9999 | -9999 | -9999 | -9999 |
| 1965 | 39 | 10 | 5 | 4 | 4 | 15 | 1157 | 1372 | 493 | 31 | 11 | 11 | 262.67 |
| 1966 | 3 | 3 | 3 | 3 | 3 | 22 | 836 | 1880 | 1963 | 37 | 46 | 62 | 405.08 |
| 1967 | 14 | 9 | 3 | 2 | 2 | 140 | 1150 | 2280 | 680 | 149 | 44 | 60 | 377.75 |
| 1968 | 10 | 4 | 6 | 4 | 3 | 150 | 263 | 3015 | 807 | 304 | 11 | 4 | 381.75 |
| 1969 | 4 | 3 | 3 | 3 | 2 | 17 | 1309 | 1709 | 4371 | 192 | 44 | 52 | 642.42 |
| 1970 | 16 | 24 | 20 | 10 | 10 | 1190 | 587 | 2609 | 4468 | 360 | 88 | 31 | 784.42 |
| 1971 | 18 | 11 | 7 | 7 | 4 | 48 | 41 | 36 | 1054 | 97 | 49 | 8 | 115 |
| 1972 | 10 | 9 | 10 | 8 | 4 | 4 | 97 | 2744 | 461 | 53 | 22 | 22 | 287 |
| 1973 | 9 | 5 | 3 | 3 | 2 | 13 | 1434 | 1396 | 2840 | 504 | 108 | 17 | 527.83 |
| 1974 | 19 | 15 | 10 | 13 | 12 | 109 | 70 | 732 | 10 | 12 | 24 | 113 | 94.92 |
| 1975 | -9999 | -9999 | -9999 | -9999 | -9999 | -9999 | -9999 | -9999 | -9999 | -9999 | -9999 | -9999 | -9999 |
| 1976 | 232 | 165 | 309 | 337 | 284 | 616 | 1074 | 2207 | 1981 | 295 | 135 | 196 | 652.58 |
| 1977 | 221 | 140 | 224 | 266 | 263 | 393 | 621 | 341 | 934 | 261 | 271 | 270 | 350.42 |
| 1978 | 288 | 275 | 301 | 263 | 235 | 250 | 363 | 856 | 1602 | 322 | 263 | 361 | 448.25 |
| 1979 | 260 | 297 | 275 | 328 | 246 | 146 | 508 | 1784 | 411 | 321 | 232 | 225 | 419.42 |
| |
|
|
|
|
|
|
|
|
|
|
|
|
|
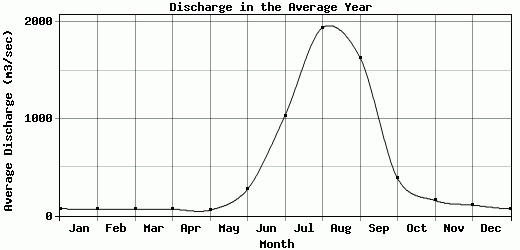
| Avg | 71.59 | 64.73 | 69.59 | 67.32 | 57.96 | 273.5 | 1035.36 | 1941.53 | 1634.66 | 384.84 | 156.45 | 109.15 | 406.51 |
| |
|
|
|
|
|
|
|
|
|
|
|
|
|
| Std Dev | 89.49 |
84.69 |
102.68 |
111.78 |
93.28 |
314.25 |
705.1 |
1665.59 |
1541.44 |
412.75 |
173.81 |
99.48 |
223.14 |
| |
|
|
|
|
|
|
|
|
|
|
|
|
|
| | Jan | Feb | Mar | Apr | May | Jun | Jul | Aug | Sep | Oct | Nov | Dec | Avg Annual |
Click here for this table in tab-delimited format.
Tab-delimited format will open in most table browsing software, i.e. Excel, etc.
View this station on the map.
Return to start.