Results
| Country: | Portugal
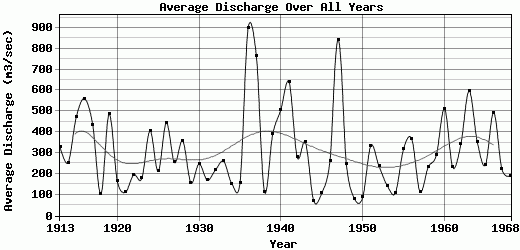
| | Station: | V.V.de Rodao | | River: | Tejo | | Area: | 59167 km2 | | Lat: | 39.66 | | Lon: | -7.67 | | Source: | RivDIS | | PointID: | 986 | | Area Units: | km2 | | Discharge Units: | m3/sec | | Starting Year: | 1913 | | Ending Year: | 1968 | | Total Years: | 56 | | Total Usable Years: | 56 | |
| |
| Year | Jan | Feb | Mar | Apr | May | Jun | Jul | Aug | Sep | Oct | Nov | Dec | Avg Annual |
|---|
| 1913 | 393 | 229 | 186 | 197 | 72 | 47 | 18 | 8 | 17 | 1037 | 1556 | 189 | 329.08 |
| 1914 | 120 | 987 | 490 | 231 | 143 | 68 | 45 | 12 | 12 | 19 | 75 | 847 | 254.08 |
| 1915 | 1126 | 827 | 1199 | 533 | 354 | 162 | 47 | 24 | 24 | 27 | 134 | 1231 | 474 |
| 1916 | 422 | 403 | 2724 | 528 | 382 | 109 | 38 | 17 | 17 | 28 | 179 | 1873 | 560 |
| 1917 | 781 | 2417 | 982 | 377 | 304 | 150 | 50 | 21 | 39 | 34 | 35 | 35 | 435.42 |
| 1918 | 451 | 97 | 82 | 257 | 90 | 42 | 15 | 7 | 19 | 21 | 74 | 84 | 103.25 |
| 1919 | 240 | 2318 | 966 | 1100 | 180 | 132 | 36 | 15 | 15 | 98 | 515 | 210 | 485.42 |
| 1920 | 198 | 401 | 404 | 325 | 158 | 78 | 29 | 12 | 14 | 84 | 136 | 174 | 167.75 |
| 1921 | 197 | 168 | 151 | 78 | 85 | 114 | 21 | 9 | 33 | 118 | 97 | 284 | 112.92 |
| 1922 | 447 | 462 | 276 | 289 | 107 | 92 | 18 | 35 | 16 | 239 | 198 | 172 | 195.92 |
| 1923 | 184 | 360 | 276 | 432 | 139 | 57 | 25 | 11 | 14 | 21 | 272 | 355 | 178.83 |
| 1924 | 473 | 701 | 1388 | 1238 | 175 | 57 | 20 | 11 | 48 | 37 | 237 | 488 | 406.08 |
| 1925 | 137 | 215 | 195 | 152 | 97 | 175 | 43 | 12 | 9 | 18 | 136 | 1361 | 212.5 |
| 1926 | 232 | 2105 | 577 | 547 | 335 | 85 | 29 | 12 | 14 | 55 | 992 | 343 | 443.83 |
| 1927 | 164 | 307 | 468 | 206 | 106 | 54 | 23 | 11 | 11 | 31 | 210 | 1463 | 254.5 |
| 1928 | 817 | 277 | 1020 | 738 | 781 | 214 | 47 | 21 | 88 | 91 | 119 | 81 | 357.83 |
| 1929 | 87 | 427 | 452 | 81 | 94 | 52 | 30 | 8 | 31 | 21 | 88 | 521 | 157.67 |
| 1930 | 469 | 614 | 485 | 455 | 335 | 331 | 76 | 23 | 16 | 54 | 38 | 79 | 247.92 |
| 1931 | 270 | 58 | 811 | 174 | 63 | 35 | 15 | 8 | 13 | 219 | 302 | 76 | 170.33 |
| 1932 | 90 | 109 | 365 | 99 | 100 | 48 | 18 | 9 | 50 | 74 | 165 | 1493 | 218.33 |
| 1933 | 934 | 533 | 1038 | 176 | 108 | 52 | 21 | 19 | 15 | 53 | 67 | 107 | 260.25 |
| 1934 | 133 | 67 | 144 | 669 | 128 | 43 | 13 | 11 | 12 | 13 | 35 | 570 | 153.17 |
| 1935 | 154 | 74 | 200 | 66 | 114 | 107 | 23 | 11 | 9 | 15 | 79 | 1026 | 156.5 |
| 1936 | 2695 | 3284 | 1303 | 1947 | 478 | 349 | 173 | 110 | 104 | 121 | 112 | 121 | 899.75 |
| 1937 | 1140 | 1773 | 1745 | 590 | 216 | 117 | 51 | 20 | 22 | 212 | 2161 | 1135 | 765.17 |
| 1938 | 347 | 159 | 108 | 75 | 158 | 38 | 17 | 12 | 40 | 29 | 51 | 326 | 113.33 |
| 1939 | 1376 | 583 | 139 | 602 | 98 | 81 | 25 | 15 | 30 | 375 | 718 | 634 | 389.67 |
| 1940 | 2200 | 1760 | 903 | 275 | 203 | 117 | 53 | 20 | 22 | 93 | 326 | 129 | 508.42 |
| 1941 | 2310 | 2059 | 1291 | 625 | 697 | 208 | 89 | 33 | 25 | 39 | 196 | 99 | 639.25 |
| 1942 | 93 | 98 | 804 | 524 | 348 | 77 | 23 | 11 | 26 | 87 | 361 | 901 | 279.42 |
| 1943 | 1152 | 782 | 947 | 487 | 291 | 52 | 23 | 14 | 56 | 83 | 172 | 149 | 350.67 |
| 1944 | 106 | 55 | 57 | 273 | 95 | 47 | 21 | 11 | 29 | 25 | 63 | 78 | 71.67 |
| 1945 | 74 | 93 | 47 | 40 | 14 | 10 | 4 | 2 | 1 | 6 | 91 | 917 | 108.25 |
| 1946 | 232 | 103 | 366 | 737 | 1243 | 192 | 39 | 16 | 21 | 40 | 76 | 92 | 263.08 |
| 1947 | 145 | 2255 | 5708 | 841 | 317 | 161 | 88 | 69 | 96 | 154 | 113 | 172 | 843.25 |
| 1948 | 750 | 677 | 295 | 244 | 449 | 180 | 47 | 34 | 34 | 44 | 66 | 141 | 246.75 |
| 1949 | 138 | 68 | 55 | 71 | 42 | 33 | 14 | 7 | 84 | 92 | 83 | 279 | 80.5 |
| 1950 | 165 | 276 | 121 | 59 | 117 | 89 | 24 | 11 | 12 | 29 | 48 | 102 | 87.75 |
| 1951 | 197 | 609 | 1217 | 268 | 260 | 141 | 54 | 39 | 48 | 66 | 861 | 264 | 335.33 |
| 1952 | 243 | 243 | 329 | 761 | 419 | 153 | 71 | 56 | 91 | 78 | 105 | 278 | 235.58 |
| 1953 | 204 | 206 | 130 | 222 | 129 | 42 | 33 | 18 | 27 | 170 | 90 | 453 | 143.67 |
| 1954 | 149 | 152 | 319 | 126 | 138 | 66 | 26 | 24 | 32 | 29 | 111 | 145 | 109.75 |
| 1955 | 540 | 1037 | 339 | 146 | 95 | 66 | 32 | 29 | 42 | 72 | 466 | 982 | 320.5 |
| 1956 | 1036 | 378 | 1105 | 868 | 286 | 142 | 71 | 55 | 70 | 151 | 122 | 109 | 366.08 |
| 1957 | 136 | 305 | 208 | 93 | 116 | 74 | 39 | 28 | 55 | 79 | 109 | 130 | 114.33 |
| 1958 | 420 | 427 | 294 | 434 | 80 | 52 | 37 | 32 | 37 | 56 | 62 | 854 | 232.08 |
| 1959 | 558 | 439 | 593 | 258 | 148 | 93 | 42 | 47 | 110 | 207 | 234 | 745 | 289.5 |
| 1960 | 797 | 1561 | 837 | 452 | 228 | 142 | 63 | 56 | 66 | 472 | 897 | 575 | 512.17 |
| 1961 | 427 | 280 | 169 | 183 | 117 | 134 | 61 | 38 | 60 | 115 | 518 | 681 | 231.92 |
| 1962 | 1122 | 305 | 1217 | 384 | 247 | 140 | 74 | 53 | 84 | 145 | 170 | 163 | 342 |
| 1963 | 1433 | 1108 | 772 | 782 | 249 | 155 | 67 | 50 | 61 | 16 | 827 | 1652 | 597.67 |
| 1964 | 320 | 1042 | 1270 | 349 | 165 | 199 | 222 | 202 | 81 | 86 | 159 | 154 | 354.08 |
| 1965 | 170 | 219 | 551 | 86 | 80 | 62 | 55 | 49 | 77 | 349 | 629 | 579 | 242.17 |
| 1966 | 995 | 1683 | 550 | 841 | 300 | 206 | 87 | 138 | 153 | 300 | 363 | 308 | 493.67 |
| 1967 | 305 | 441 | 459 | 236 | 319 | 286 | 173 | 64 | 53 | 38 | 170 | 155 | 224.92 |
| 1968 | 123 | 411 | 280 | 255 | 221 | 123 | 122 | 96 | 101 | 97 | 211 | 241 | 190.08 |
| |
|
|
|
|
|
|
|
|
|
|
|
|
|
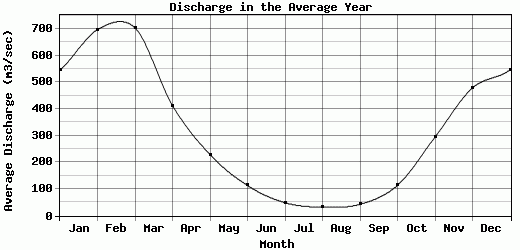
| Avg | 546.73 | 696.91 | 703.7 | 412.18 | 228.8 | 113.05 | 48.57 | 31.89 | 42.61 | 113.61 | 294.29 | 478.66 | 309.25 |
| |
|
|
|
|
|
|
|
|
|
|
|
|
|
| Std Dev | 574.02 |
740.23 |
845.51 |
346.09 |
202.63 |
72.48 |
41.2 |
35.04 |
32.45 |
157.48 |
385.76 |
461.42 |
187.76 |
| |
|
|
|
|
|
|
|
|
|
|
|
|
|
| | Jan | Feb | Mar | Apr | May | Jun | Jul | Aug | Sep | Oct | Nov | Dec | Avg Annual |
Click here for this table in tab-delimited format.
Tab-delimited format will open in most table browsing software, i.e. Excel, etc.
View this station on the map.
Return to start.