Results
| Country: | U.S.A.
| | Station: | BARSTOW, TEX.(DISC) | | River: | PECOS R | | Area: | 67284.21 | | Lat: | 31.42 | | Lon: | -103.25 | | Source: | USGS | | PointID: | 8435500 | | Area Units: | km2 | | Discharge Units: | m3/sec | | Starting Year: | 1923 | | Ending Year: | 1955 | | Total Years: | 33 | | Total Usable Years: | 32 | |
| |
| Year | Jan | Feb | Mar | Apr | May | Jun | Jul | Aug | Sep | Oct | Nov | Dec | Avg Annual |
|---|
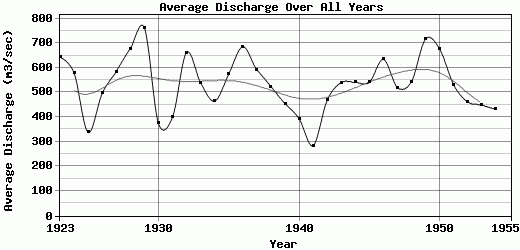
| 1923 | 846.4 | 1468.34 | 1336.47 | 686.78 | 823.11 | 713.59 | 440.83 | 414.16 | 249.62 | 156.62 | 178.41 | 407.11 | 643.45 |
| 1924 | 996.67 | 688.98 | 907.24 | 848.66 | 779.27 | 583.9 | 479.47 | 288.94 | 274.16 | 328.43 | 205.86 | 568.93 | 579.21 |
| 1925 | 948.16 | 572.51 | 412.51 | 332.46 | 366.88 | 210.25 | 172.19 | 92.09 | 81.12 | 231.75 | 368.32 | 268.55 | 338.07 |
| 1926 | 562.34 | 740.69 | 657.59 | 691.88 | 358.38 | 258.14 | 204.9 | 333.34 | 217.08 | 176.72 | 439.48 | 1312.26 | 496.07 |
| 1927 | 654.21 | 1299.14 | 1041.15 | 748.14 | 458.74 | 795.14 | 342.76 | 340.11 | 210.59 | 180.53 | 256.98 | 693.81 | 585.11 |
| 1928 | 555.56 | 518.4 | 636.77 | 922 | 1016.58 | 873.67 | 753.96 | 732.31 | 922.19 | 480.75 | 384.83 | 342.76 | 678.32 |
| 1929 | 650.01 | 768.71 | 1842.52 | 706.23 | 1316.28 | 689.52 | 538.75 | 322.46 | 373.79 | 530.94 | 875.37 | 531.63 | 762.18 |
| 1930 | 531.17 | 672.73 | 847.96 | 521.69 | 492.9 | 267.89 | 186.07 | 176.81 | 183.92 | 140.84 | 215.73 | 257.96 | 374.64 |
| 1931 | 369.13 | 371.26 | 340.65 | 1047.26 | 520.58 | 308.87 | 340.2 | 373.98 | 253.04 | 134.93 | 124.62 | 606.56 | 399.26 |
| 1932 | 795.8 | 1523.26 | 832.98 | 809.02 | 738.43 | 380.11 | 350.11 | 248.15 | 142.81 | 391.46 | 479.88 | 1253.16 | 662.1 |
| 1933 | 1073.03 | 1474.91 | 814.52 | 678.38 | 760.08 | 320.5 | 266.44 | 300.61 | 303.02 | 162.93 | 149.35 | 167.79 | 539.3 |
| 1934 | 337.42 | 295.1 | 1289.06 | 703.21 | 351.86 | 421.73 | 365.61 | 422.52 | 238.58 | 355.17 | 342.46 | 457.82 | 465.05 |
| 1935 | 884.13 | 711.36 | 1387.26 | 1186.2 | 619.23 | 376.24 | 363.83 | 320.13 | 248.55 | 142.2 | 407.34 | 244.91 | 574.28 |
| 1936 | 1406.98 | 1192.34 | 1416.95 | 1574.33 | 412.33 | 241.37 | 278.28 | 238.18 | 213.98 | 487.97 | 270.28 | 492.27 | 685.44 |
| 1937 | 1832.57 | 1140.27 | 633.39 | 543.59 | 499.93 | 319.81 | 262.3 | 354.91 | 342.12 | 457.94 | 337.87 | 376.37 | 591.76 |
| 1938 | 614.84 | 605.68 | 956.84 | 752.38 | 551.63 | 537.27 | 667 | 542.12 | 262.4 | 185.64 | 307.3 | 307.19 | 524.19 |
| 1939 | 469.79 | 1558.04 | 992.28 | 617.97 | 367.66 | 316.24 | 337.34 | 273.26 | 164.79 | 120 | 108.1 | 133.53 | 454.92 |
| 1940 | 158.35 | 360.73 | 557.39 | 650.91 | 327.04 | 310.41 | 357.05 | 831.41 | 511.47 | 192.61 | 216.72 | 246.49 | 393.38 |
| 1941 | 349.06 | 246.28 | 481.46 | 443.63 | 236.79 | 187.85 | 585.28 | 240.87 | 160.72 | 121.78 | 155.75 | 201 | 284.21 |
| 1942 | 249.88 | 434.56 | 693.31 | 292.4 | 410.5 | 329.52 | 389.68 | 619.14 | 468.74 | 439.92 | 401.82 | 887.6 | 468.09 |
| 1943 | 952.73 | 1030.03 | 577.12 | 548.5 | 495.73 | 377.37 | 523.04 | 360.54 | 383.98 | 443.19 | 465.91 | 326.29 | 540.37 |
| 1944 | 304.34 | 624.34 | 1150.04 | 772.02 | 537.02 | 461.57 | 445.03 | 405.24 | 391.1 | 389.05 | 422.3 | 587.71 | 540.81 |
| 1945 | 583.06 | 668.79 | 658.32 | 535 | 398.84 | 518.39 | 509.43 | 489.79 | 470.35 | 398.53 | 422.77 | 840.65 | 541.16 |
| 1946 | 1400.78 | 1215.61 | 535.56 | 488.85 | 417.47 | 477.6 | 569.45 | 541.59 | 547.08 | 544.78 | 441.27 | 431.06 | 634.26 |
| 1947 | 1109.3 | 703.98 | 546.34 | 474.14 | 524.05 | 389.49 | 336.57 | 373 | 386.43 | 400.24 | 462.61 | 525.69 | 519.32 |
| 1948 | 452.62 | 791.51 | 550.26 | 525.85 | 502.76 | 479.12 | 420.38 | 441.84 | 472.71 | 439.25 | 464.6 | 993.1 | 544.5 |
| 1949 | 1031.93 | 737.25 | 489.47 | 471.95 | 468.81 | 489.96 | 754.24 | 777.44 | 774 | 750.49 | 861.69 | 998.13 | 717.11 |
| 1950 | 814.8 | 1680.72 | 793.79 | 565.21 | 348.53 | 416.48 | 383.1 | 454.16 | 484.88 | 695.87 | 730.39 | 740.17 | 675.68 |
| 1951 | 582.42 | 598.62 | 588.49 | 475.01 | 473.54 | 454.88 | 367.31 | 488.42 | 457.51 | 522.22 | 431.26 | 920.3 | 530 |
| 1952 | 666.36 | 656.86 | 571 | 476.43 | 351.16 | 370.07 | 423.51 | 390.71 | 369.65 | 411.47 | 350.64 | 499.05 | 461.41 |
| 1953 | 479.83 | 750 | 601.96 | 541.99 | 349.22 | 500.44 | 367.69 | 418.44 | 334.23 | 298.43 | 337.21 | 401.26 | 448.39 |
| 1954 | 767.44 | 519.88 | 519.11 | 382.62 | 352.68 | 412.24 | 470.42 | 419.02 | 342.48 | 264.01 | 320.23 | 401.88 | 431 |
| 1955 | -9999 | -9999 | -9999 | -9999 | -9999 | -9999 | -9999 | -9999 | -9999 | -9999 | -9999 | -9999 | -9999 |
| |
|
|
|
|
|
|
|
|
|
|
|
|
|
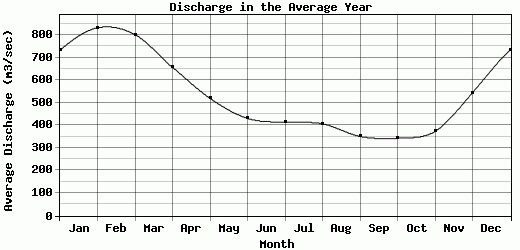
| Avg | 732.22 | 831.9 | 801.87 | 656.71 | 519.63 | 430.93 | 414.13 | 407.05 | 351.16 | 343.02 | 373.04 | 544.47 | 533.85 |
| |
|
|
|
|
|
|
|
|
|
|
|
|
|
| Std Dev | 364.05 |
394.19 |
343.8 |
253.76 |
220.02 |
160.49 |
142.79 |
161.11 |
174.76 |
168.53 |
181.49 |
302.91 |
112.11 |
| |
|
|
|
|
|
|
|
|
|
|
|
|
|
| | Jan | Feb | Mar | Apr | May | Jun | Jul | Aug | Sep | Oct | Nov | Dec | Avg Annual |
Click here for this table in tab-delimited format.
Tab-delimited format will open in most table browsing software, i.e. Excel, etc.
View this station on the map.
Return to start.