Results
| Country: | Italy
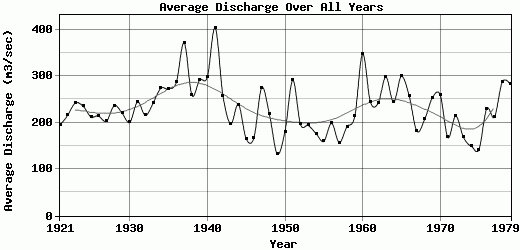
| | Station: | Rome | | River: | Tiber | | Area: | 16545 km2 | | Lat: | 41.9 | | Lon: | 12.48 | | Source: | RivDIS | | PointID: | 202 | | Area Units: | km2 | | Discharge Units: | m3/sec | | Starting Year: | 1921 | | Ending Year: | 1979 | | Total Years: | 59 | | Total Usable Years: | 59 | |
| |
| Year | Jan | Feb | Mar | Apr | May | Jun | Jul | Aug | Sep | Oct | Nov | Dec | Avg Annual |
|---|
| 1921 | 152 | 280 | 154 | 289 | 320 | 301 | 151 | 133 | 128 | 143 | 142 | 147 | 195 |
| 1922 | 165 | 279 | 271 | 361 | 186 | 142 | 112 | 107 | 126 | 339 | 304 | 199 | 215.92 |
| 1923 | 239 | 324 | 335 | 305 | 255 | 162 | 130 | 122 | 136 | 126 | 246 | 528 | 242.33 |
| 1924 | 307 | 390 | 481 | 431 | 194 | 168 | 139 | 137 | 142 | 147 | 129 | 154 | 234.92 |
| 1925 | 122 | 283 | 383 | 339 | 268 | 156 | 136 | 120 | 118 | 121 | 231 | 269 | 212.17 |
| 1926 | 268 | 313 | 212 | 324 | 249 | 172 | 161 | 134 | 124 | 130 | 201 | 280 | 214 |
| 1927 | 466 | 275 | 281 | 201 | 172 | 134 | 116 | 111 | 121 | 125 | 161 | 277 | 203.33 |
| 1928 | 178 | 156 | 350 | 276 | 387 | 168 | 124 | 115 | 137 | 230 | 437 | 281 | 236.58 |
| 1929 | 512 | 288 | 271 | 192 | 231 | 155 | 125 | 124 | 116 | 123 | 328 | 181 | 220.5 |
| 1930 | 208 | 282 | 201 | 339 | 308 | 185 | 139 | 128 | 133 | 138 | 181 | 167 | 200.75 |
| 1931 | 270 | 417 | 451 | 320 | 338 | 179 | 143 | 134 | 134 | 143 | 238 | 166 | 244.42 |
| 1932 | 245 | 167 | 383 | 314 | 273 | 180 | 176 | 122 | 122 | 153 | 149 | 306 | 215.83 |
| 1933 | 178 | 326 | 286 | 179 | 173 | 162 | 119 | 103 | 130 | 148 | 432 | 663 | 241.58 |
| 1934 | 322 | 219 | 471 | 341 | 248 | 180 | 144 | 132 | 140 | 145 | 452 | 493 | 273.92 |
| 1935 | 276 | 432 | 465 | 200 | 191 | 152 | 127 | 125 | 118 | 271 | 413 | 498 | 272.33 |
| 1936 | 403 | 397 | 631 | 321 | 336 | 242 | 177 | 152 | 191 | 220 | 196 | 175 | 286.75 |
| 1937 | 247 | 302 | 597 | 468 | 292 | 199 | 176 | 157 | 211 | 341 | 456 | 1015 | 371.75 |
| 1938 | 422 | 310 | 234 | 201 | 340 | 221 | 165 | 159 | 171 | 214 | 249 | 423 | 259.08 |
| 1939 | 369 | 265 | 343 | 262 | 338 | 360 | 185 | 166 | 205 | 262 | 373 | 368 | 291.33 |
| 1940 | 386 | 539 | 265 | 253 | 271 | 287 | 214 | 167 | 164 | 337 | 396 | 303 | 298.5 |
| 1941 | 571 | 990 | 588 | 418 | 534 | 315 | 228 | 197 | 212 | 208 | 337 | 247 | 403.75 |
| 1942 | 262 | 546 | 355 | 271 | 322 | 189 | 164 | 150 | 171 | 170 | 207 | 289 | 258 |
| 1943 | 396 | 301 | 200 | 170 | 165 | 125 | 114 | 102 | 107 | 124 | 216 | 346 | 197.17 |
| 1944 | 247 | 245 | 317 | 191 | 163 | 165 | 123 | 120 | 128 | 265 | 466 | 438 | 239 |
| 1945 | 343 | 288 | 187 | 165 | 161 | 118 | 106 | 105 | 110 | 118 | 131 | 153 | 165.42 |
| 1946 | 168 | 126 | 147 | 110 | 125 | 96 | 85 | 76 | 91 | 143 | 579 | 265 | 167.58 |
| 1947 | 219 | 913 | 436 | 324 | 178 | 154 | 142 | 139 | 177 | 160 | 158 | 301 | 275.08 |
| 1948 | 510 | 394 | 214 | 198 | 197 | 171 | 137 | 129 | 135 | 192 | 168 | 167 | 217.67 |
| 1949 | 171 | 118 | 137 | 113 | 114 | 112 | 102 | 83 | 94 | 107 | 228 | 212 | 132.58 |
| 1950 | 210 | 229 | 210 | 201 | 153 | 110 | 111 | 111 | 135 | 160 | 183 | 357 | 180.83 |
| 1951 | 451 | 576 | 544 | 325 | 347 | 187 | 149 | 130 | 144 | 145 | 283 | 208 | 290.75 |
| 1952 | 335 | 333 | 170 | 163 | 137 | 117 | 110 | 105 | 133 | 134 | 180 | 435 | 196 |
| 1953 | 395 | 330 | 186 | 171 | 158 | 246 | 137 | 126 | 121 | 175 | 135 | 148 | 194 |
| 1954 | 176 | 331 | 285 | 168 | 298 | 187 | 123 | 107 | 103 | 104 | 116 | 120 | 176.5 |
| 1955 | 136 | 244 | 408 | 173 | 122 | 94 | 91 | 82 | 99 | 107 | 164 | 197 | 159.75 |
| 1956 | 262 | 256 | 354 | 286 | 332 | 154 | 113 | 96 | 99 | 101 | 183 | 147 | 198.58 |
| 1957 | 182 | 268 | 195 | 263 | 183 | 152 | 98 | 92 | 96 | 108 | 108 | 138 | 156.92 |
| 1958 | 170 | 149 | 284 | 501 | 190 | 140 | 110 | 97 | 100 | 108 | 150 | 298 | 191.42 |
| 1959 | 243 | 213 | 164 | 233 | 178 | 130 | 96 | 100 | 112 | 137 | 226 | 732 | 213.67 |
| 1960 | 433 | 521 | 535 | 387 | 305 | 188 | 151 | 126 | 224 | 334 | 337 | 631 | 347.67 |
| 1961 | 604 | 284 | 219 | 198 | 194 | 180 | 135 | 129 | 150 | 204 | 361 | 282 | 245 |
| 1962 | 268 | 286 | 414 | 279 | 188 | 148 | 131 | 116 | 136 | 151 | 459 | 321 | 241.42 |
| 1963 | 579 | 604 | 324 | 320 | 228 | 223 | 194 | 153 | 167 | 230 | 181 | 373 | 298 |
| 1964 | 248 | 214 | 305 | 305 | 178 | 130 | 120 | 126 | 141 | 354 | 281 | 525 | 243.92 |
| 1965 | 463 | 319 | 372 | 259 | 207 | 203 | 152 | 125 | 492 | 229 | 391 | 383 | 299.58 |
| 1966 | 433 | 406 | 294 | 223 | 203 | 172 | 152 | 142 | 133 | 186 | 350 | 402 | 258 |
| 1967 | 293 | 259 | 203 | 192 | 164 | 156 | 119 | 118 | 139 | 132 | 184 | 221 | 181.67 |
| 1968 | 243 | 445 | 241 | 190 | 158 | 231 | 147 | 128 | 117 | 137 | 177 | 267 | 206.75 |
| 1969 | 298 | 590 | 411 | 269 | 213 | 166 | 158 | 149 | 192 | 162 | 208 | 225 | 253.42 |
| 1970 | 402 | 405 | 462 | 292 | 256 | 222 | 167 | 171 | 177 | 192 | 184 | 187 | 259.75 |
| 1971 | 269 | 230 | 187 | 161 | 136 | 151 | 144 | 99.5 | 120 | 133 | 190 | 197 | 168.13 |
| 1972 | 213 | 352 | 234 | 246 | 276 | 167 | 137 | 128 | 181 | 205 | 211 | 223 | 214.42 |
| 1973 | 291 | 278 | 190 | 212 | 155 | 122 | 122 | 114 | 137 | 135 | 130 | 139 | 168.75 |
| 1974 | 141 | 157 | 168 | 168 | 300 | 119 | 104 | 103 | 119 | 139 | 151 | 124 | 149.42 |
| 1975 | 115 | 109 | 192 | 157 | 132 | 122 | 104 | 91.5 | 110 | 112 | 258 | 202 | 142.04 |
| 1976 | 138 | 370 | 260 | 223 | 183 | 173 | 143 | 129 | 149 | 195 | 354 | 443 | 230 |
| 1977 | 396 | 426 | 235 | 208 | 181 | 159 | 136 | 140 | 132 | 140 | 148 | 241 | 211.83 |
| 1978 | 353 | 419 | 489 | 501 | 431 | 285 | 166 | 141 | 136 | 186 | 151 | 193 | 287.58 |
| 1979 | 399 | 620 | 376 | 458 | 241 | 156 | 134 | 126 | 127 | 193 | 297 | 278 | 283.75 |
| |
|
|
|
|
|
|
|
|
|
|
|
|
|
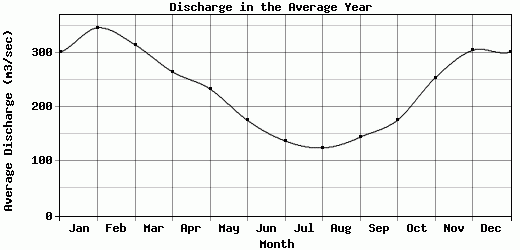
| Avg | 301.03 | 345.56 | 314.53 | 264.54 | 233.15 | 175.25 | 137.53 | 124.58 | 144.29 | 175.78 | 253.14 | 304.2 | 231.13 |
| |
|
|
|
|
|
|
|
|
|
|
|
|
|
| Std Dev | 122.89 |
165.83 |
125.42 |
92.98 |
83.87 |
53.43 |
28.73 |
23.29 |
55.12 |
65.43 |
111.61 |
167.01 |
54.39 |
| |
|
|
|
|
|
|
|
|
|
|
|
|
|
| | Jan | Feb | Mar | Apr | May | Jun | Jul | Aug | Sep | Oct | Nov | Dec | Avg Annual |
Click here for this table in tab-delimited format.
Tab-delimited format will open in most table browsing software, i.e. Excel, etc.
View this station on the map.
Return to start.