Results
| Country: | Hungary
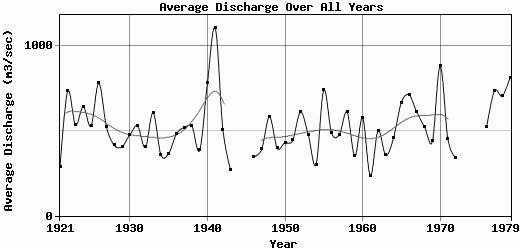
| | Station: | Polgar | | River: | Tisza | | Area: | 62723 km2 | | Lat: | 47.86 | | Lon: | 21.12 | | Source: | RivDIS | | PointID: | 770 | | Area Units: | km2 | | Discharge Units: | m3/sec | | Starting Year: | 1921 | | Ending Year: | 1979 | | Total Years: | 59 | | Total Usable Years: | 55 | |
| |
| Year | Jan | Feb | Mar | Apr | May | Jun | Jul | Aug | Sep | Oct | Nov | Dec | Avg Annual |
|---|
| 1921 | 417 | 265 | 648 | 540 | 404 | 300 | 256 | 106 | 124 | 84.7 | 204 | 103 | 287.64 |
| 1922 | 158 | 179 | 1520 | 1710 | 929 | 585 | 319 | 126 | 471 | 1280 | 1010 | 520 | 733.92 |
| 1923 | 738 | 556 | 997 | 794 | 588 | 449 | 288 | 82.1 | 91.1 | 271 | 520 | 1050 | 535.35 |
| 1924 | 440 | 597 | 1040 | 2040 | 1350 | 550 | 318 | 297 | 393 | 237 | 257 | 169 | 640.67 |
| 1925 | 142 | 341 | 608 | 523 | 431 | 221 | 784 | 712 | 845 | 239 | 827 | 661 | 527.83 |
| 1926 | 1380 | 1030 | 611 | 1010 | 756 | 980 | 631 | 838 | 345 | 621 | 787 | 369 | 779.83 |
| 1927 | 630 | 317 | 902 | 870 | 590 | 628 | 321 | 266 | 412 | 346 | 626 | 347 | 521.25 |
| 1928 | 251 | 326 | 477 | 1140 | 650 | 736 | 254 | 146 | 152 | 258 | 321 | 268 | 414.92 |
| 1929 | 286 | 194 | 496 | 838 | 840 | 507 | 499 | 292 | 168 | 174 | 324 | 253 | 405.92 |
| 1930 | 129 | 450 | 582 | 785 | 681 | 457 | 130 | 229 | 118 | 305 | 1220 | 624 | 475.83 |
| 1931 | 467 | 367 | 984 | 697 | 552 | 275 | 178 | 169 | 456 | 574 | 1290 | 335 | 528.67 |
| 1932 | 843 | 332 | 327 | 218 | 966 | 459 | 269 | 284 | 124 | 267 | 393 | 344 | 402.17 |
| 1933 | 136 | 175 | 770 | 411 | 834 | 765 | 1350 | 469 | 552 | 554 | 803 | 453 | 606 |
| 1934 | 411 | 206 | 1030 | 372 | 160 | 189 | 442 | 213 | 257 | 277 | 369 | 390 | 359.67 |
| 1935 | 169 | 252 | 908 | 774 | 838 | 449 | 159 | 111 | 175 | 125 | 154 | 271 | 365.42 |
| 1936 | 607 | 654 | 670 | 845 | 361 | 376 | 197 | 251 | 226 | 706 | 635 | 236 | 480.33 |
| 1937 | 215 | 683 | 1760 | 1090 | 437 | 192 | 215 | 321 | 233 | 123 | 322 | 620 | 517.58 |
| 1938 | 394 | 396 | 796 | 826 | 1030 | 524 | 386 | 585 | 498 | 190 | 401 | 294 | 526.67 |
| 1939 | 554 | 342 | 283 | 642 | 732 | 425 | 175 | 179 | 100 | 214 | 479 | 498 | 385.25 |
| 1940 | 226 | 357 | 886 | 2080 | 966 | 1120 | 807 | 451 | 696 | 474 | 984 | 302 | 779.08 |
| 1941 | 769 | 1590 | 1380 | 1990 | 2080 | 932 | 506 | 514 | 1120 | 933 | 952 | 511 | 1106.42 |
| 1942 | 421 | 407 | 1170 | 1080 | 1240 | 600 | 291 | 221 | 128 | 138 | 177 | 186 | 504.92 |
| 1943 | 148 | 323 | 270 | 508 | 328 | 329 | 433 | 158 | 119 | 94.7 | 185 | 307 | 266.89 |
| 1944 | 204 | 626 | 338 | 1250 | 979 | 551 | 471 | 338 | 138 | 341 | -9999 | -9999 | -9999 |
| 1945 | -9999 | -9999 | -9999 | 1140 | 1040 | 664 | 548 | 390 | 190 | 343 | 270 | 373 | -9999 |
| 1946 | 462 | 566 | 897 | 718 | 445 | 236 | 143 | 85.6 | 75.9 | 77.9 | 247 | 212 | 347.12 |
| 1947 | 127 | 398 | 1370 | 774 | 267 | 200 | 152 | 129 | 203 | 85.6 | 469 | 524 | 391.55 |
| 1948 | 2000 | 856 | 453 | 710 | 347 | 838 | 819 | 323 | 162 | 147 | 212 | 122 | 582.42 |
| 1949 | 244 | 180 | 448 | 731 | 395 | 406 | 717 | 466 | 186 | 107 | 266 | 609 | 396.25 |
| 1950 | 321 | 722 | 864 | 659 | 314 | 135 | 114 | 146 | 85.9 | 189 | 567 | 1040 | 429.74 |
| 1951 | 379 | 435 | 1030 | 926 | 1040 | 512 | 257 | 188 | 132 | 136 | 132 | 156 | 443.58 |
| 1952 | 274 | 508 | 421 | 1970 | 621 | 362 | 150 | 90.8 | 142 | 570 | 946 | 1280 | 611.23 |
| 1953 | 1410 | 577 | 613 | 704 | 483 | 684 | 345 | 237 | 218 | 172 | 130 | 144 | 476.42 |
| 1954 | 128 | 125 | 615 | 404 | 560 | 557 | 366 | 238 | 137 | 185 | 122 | 167 | 300.33 |
| 1955 | 823 | 1030 | 998 | 1150 | 865 | 652 | 889 | 981 | 299 | 245 | 254 | 683 | 739.08 |
| 1956 | 726 | 485 | 690 | 1340 | 843 | 358 | 481 | 178 | 113 | 109 | 125 | 410 | 488.17 |
| 1957 | 161 | 940 | 929 | 697 | 750 | 583 | 356 | 206 | 277 | 280 | 135 | 414 | 477.33 |
| 1958 | 250 | 1160 | 1050 | 1360 | 1120 | 376 | 522 | 185 | 170 | 207 | 297 | 625 | 610.17 |
| 1959 | 697 | 276 | 618 | 557 | 283 | 390 | 288 | 401 | 160 | 140 | 144 | 234 | 349 |
| 1960 | 448 | 764 | 484 | 670 | 402 | 410 | 605 | 672 | 253 | 412 | 880 | 914 | 576.17 |
| 1961 | 489 | 342 | 478 | 468 | 226 | 246 | 99.6 | 106 | 77.6 | 71.8 | 90.7 | 120 | 234.56 |
| 1962 | 359 | 305 | 966 | 2150 | 704 | 411 | 472 | 165 | 98.2 | 81.6 | 162 | 131 | 500.4 |
| 1963 | 374 | 366 | 1010 | 991 | 428 | 195 | 112 | 117 | 110 | 139 | 256 | 163 | 355.08 |
| 1964 | 110 | 118 | 541 | 1840 | 514 | 174 | 187 | 243 | 250 | 369 | 357 | 802 | 458.75 |
| 1965 | 350 | 608 | 1110 | 757 | 713 | 1530 | 655 | 419 | 293 | 153 | 323 | 1090 | 666.75 |
| 1966 | 413 | 1460 | 1230 | 773 | 386 | 466 | 603 | 608 | 576 | 305 | 871 | 839 | 710.83 |
| 1967 | 390 | 429 | 2240 | 1930 | 754 | 545 | 215 | 114 | 117 | 149 | 128 | 294 | 608.75 |
| 1968 | 369 | 825 | 1110 | 1200 | 506 | 186 | 117 | 306 | 568 | 457 | 299 | 302 | 520.42 |
| 1969 | 169 | 554 | 748 | 713 | 510 | 640 | 568 | 206 | 183 | 117 | 323 | 519 | 437.5 |
| 1970 | 623 | 725 | 1010 | 1900 | 1980 | 1580 | 652 | 490 | 340 | 255 | 543 | 455 | 879.42 |
| 1971 | 923 | 668 | 584 | 593 | 700 | 420 | 535 | 140 | 130 | 110 | 266 | 314 | 448.58 |
| 1972 | 156 | 316 | 352 | 447 | 468 | 244 | 182 | 247 | 387 | 329 | 637 | 336 | 341.75 |
| 1973 | -9999 | -9999 | -9999 | -9999 | -9999 | -9999 | -9999 | -9999 | -9999 | -9999 | -9999 | -9999 | -9999 |
| 1974 | -9999 | -9999 | -9999 | -9999 | -9999 | -9999 | -9999 | -9999 | -9999 | -9999 | -9999 | -9999 | -9999 |
| 1975 | -9999 | -9999 | -9999 | -9999 | -9999 | -9999 | -9999 | -9999 | -9999 | -9999 | -9999 | -9999 | -9999 |
| 1976 | 267 | 317 | 656 | 1676 | 792 | 628 | 151 | 188 | 250 | 348 | 262 | 758 | 524.42 |
| 1977 | 497 | 1600 | 1970 | 1600 | 768 | 304 | 447 | 423 | 308 | 206 | 372 | 320 | 734.58 |
| 1978 | 215 | 563 | 1270 | 732 | 1420 | 968 | 931 | 311 | 670 | 620 | 232 | 529 | 705.08 |
| 1979 | 1160 | 2270 | 1210 | 1590 | 961 | 305 | 393 | 577 | 230 | 171 | 295 | 589 | 812.58 |
| |
|
|
|
|
|
|
|
|
|
|
|
|
|
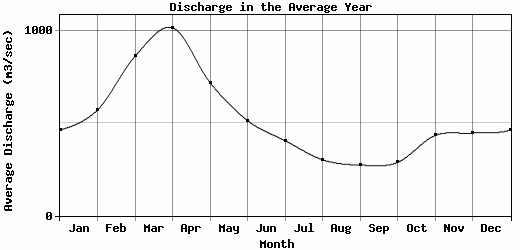
| Avg | 462.71 | 571.87 | 862.15 | 1016.13 | 720.13 | 514.36 | 406.26 | 302.4 | 273.8 | 287.74 | 433.69 | 446.89 | 524.26 |
| |
|
|
|
|
|
|
|
|
|
|
|
|
|
| Std Dev | 363.03 |
410.11 |
407.53 |
512.52 |
379.7 |
297.71 |
252.31 |
196 |
207.8 |
223.87 |
302.79 |
271.37 |
167.78 |
| |
|
|
|
|
|
|
|
|
|
|
|
|
|
| | Jan | Feb | Mar | Apr | May | Jun | Jul | Aug | Sep | Oct | Nov | Dec | Avg Annual |
Click here for this table in tab-delimited format.
Tab-delimited format will open in most table browsing software, i.e. Excel, etc.
View this station on the map.
Return to start.