Results
| Country: | U.S.S.R.
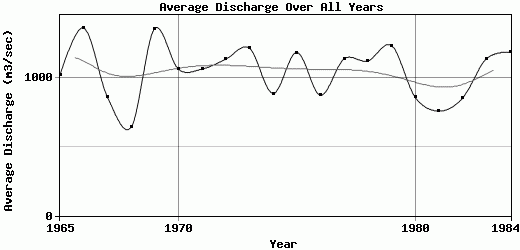
| | Station: | Tomsk | | River: | Tom | | Area: | 57000 km2 | | Lat: | 56.58 | | Lon: | 84.87 | | Source: | RivDIS | | PointID: | 878 | | Area Units: | km2 | | Discharge Units: | m3/sec | | Starting Year: | 1965 | | Ending Year: | 1984 | | Total Years: | 20 | | Total Usable Years: | 20 | |
| |
| Year | Jan | Feb | Mar | Apr | May | Jun | Jul | Aug | Sep | Oct | Nov | Dec | Avg Annual |
|---|
| 1965 | 212 | 168 | 175 | 1510 | 5900 | 1190 | 278 | 193 | 1120 | 861 | 389 | 262 | 1021.5 |
| 1966 | 220 | 175 | 136 | 1150 | 7500 | 4850 | 1110 | 452 | 243 | 246 | 156 | 176 | 1367.83 |
| 1967 | 128 | 104 | 105 | 1850 | 3450 | 1060 | 1350 | 540 | 686 | 651 | 285 | 178 | 865.58 |
| 1968 | 150 | 130 | 277 | 1470 | 3030 | 703 | 408 | 558 | 313 | 264 | 221 | 187 | 642.58 |
| 1969 | 122 | 96 | 95 | 658 | 6870 | 4670 | 496 | 512 | 703 | 1170 | 651 | 293 | 1361.33 |
| 1970 | 163 | 74 | 64 | 2220 | 4230 | 2930 | 610 | 648 | 445 | 835 | 355 | 233 | 1067.25 |
| 1971 | 163 | 74 | 64 | 2220 | 4230 | 2930 | 610 | 648 | 445 | 835 | 355 | 233 | 1067.25 |
| 1972 | 111 | 97.5 | 103 | 2700 | 3890 | 2130 | 1420 | 758 | 826 | 822 | 588 | 229 | 1139.54 |
| 1973 | 198 | 156 | 148 | 3210 | 4920 | 3530 | 912 | 566 | 244 | 299 | 256 | 188 | 1218.92 |
| 1974 | 163 | 112 | 109 | 2740 | 3350 | 1230 | 298 | 171 | 706 | 1220 | 355 | 226 | 890 |
| 1975 | 176 | 147 | 145 | 1760 | 4950 | 4330 | 743 | 330 | 458 | 796 | 252 | 173 | 1188.33 |
| 1976 | 139 | 112 | 114 | 1410 | 3900 | 1370 | 435 | 829 | 876 | 915 | 232 | 196 | 877.33 |
| 1977 | 146 | 111 | 119 | 3020 | 5040 | 1560 | 448 | 370 | 801 | 972 | 764 | 355 | 1142.17 |
| 1978 | 197 | 100 | 82.2 | 3460 | 4480 | 2340 | 603 | 591 | 451 | 511 | 495 | 204 | 1126.18 |
| 1979 | 179 | 114 | 110 | 1090 | 6720 | 2620 | 510 | 425 | 829 | 1140 | 887 | 243 | 1238.92 |
| 1980 | 197 | 166 | 143 | 1570 | 3630 | 1610 | 798 | 701 | 426 | 407 | 462 | 239 | 862.42 |
| 1981 | 170 | 147 | 153 | 2480 | 2820 | 970 | 241 | 350 | 369 | 931 | 319 | 192 | 761.83 |
| 1982 | 160 | 133 | 113 | 2490 | 3250 | 999 | 444 | 434 | 347 | 1050 | 619 | 221 | 855 |
| 1983 | 225 | 195 | 212 | 1180 | 4830 | 2630 | 789 | 529 | 634 | 1160 | 1050 | 271 | 1142.08 |
| 1984 | 238 | 174 | 160 | 842 | 6230 | 2200 | 1250 | 1100 | 317 | 858 | 691 | 248 | 1192.33 |
| |
|
|
|
|
|
|
|
|
|
|
|
|
|
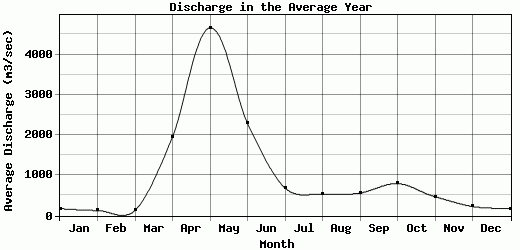
| Avg | 172.85 | 129.28 | 131.36 | 1951.5 | 4661 | 2292.6 | 687.65 | 535.25 | 561.95 | 797.15 | 469.1 | 227.35 | 1051.42 |
| |
|
|
|
|
|
|
|
|
|
|
|
|
|
| Std Dev | 34.53 |
34.28 |
48.78 |
796.65 |
1329.76 |
1237.19 |
347.2 |
211.64 |
239.44 |
299.69 |
237.59 |
43.94 |
193.05 |
| |
|
|
|
|
|
|
|
|
|
|
|
|
|
| | Jan | Feb | Mar | Apr | May | Jun | Jul | Aug | Sep | Oct | Nov | Dec | Avg Annual |
Click here for this table in tab-delimited format.
Tab-delimited format will open in most table browsing software, i.e. Excel, etc.
View this station on the map.
Return to start.