Results
| Country: | U.S.A.
| | Station: | GAINESVILLE, AL | | River: | TOMBIGBEE RIVER | | Area: | 22355.55 | | Lat: | 32.82 | | Lon: | -88.15 | | Source: | USGS | | PointID: | 2449000 | | Area Units: | km2 | | Discharge Units: | m3/sec | | Starting Year: | 1984 | | Ending Year: | 1991 | | Total Years: | 8 | | Total Usable Years: | 7 | |
| |
| Year | Jan | Feb | Mar | Apr | May | Jun | Jul | Aug | Sep | Oct | Nov | Dec | Avg Annual |
|---|
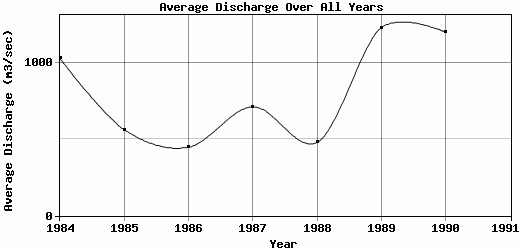
| 1984 | 2160.86 | 1403.94 | 1544.83 | 1469.46 | 1638.64 | 421.21 | 452.36 | 1291.25 | 315.94 | 329.44 | 454.77 | 833.52 | 1026.35 |
| 1985 | 542.68 | 1916.96 | 720.9 | 388.73 | 464.93 | 215.26 | 492.89 | 473.81 | 227.9 | 305.39 | 401.16 | 585.27 | 561.32 |
| 1986 | 372.38 | 708.79 | 943.89 | 235.08 | 213.86 | 195.22 | 170.16 | 167.08 | 157.58 | 149.27 | 880.94 | 1163.01 | 446.44 |
| 1987 | 1704.04 | 1728.45 | 2100.48 | 699.68 | 385.07 | 436.31 | 384.82 | 211.88 | 192.69 | 175 | 186.88 | 317.72 | 710.25 |
| 1988 | 1016.76 | 922.84 | 466.7 | 446.54 | 217.45 | 177.57 | 209.33 | 150.39 | 560.07 | 339.13 | 755.42 | 482.1 | 478.69 |
| 1989 | 1390.36 | 779.68 | 2056.27 | 1767.38 | 571.12 | 1975.41 | 1755.01 | 419.4 | 443.57 | 1072.39 | 1034.59 | 1441.15 | 1225.53 |
| 1990 | 2618.23 | 3858.8 | 3819.23 | 1059.24 | 754.05 | 325.57 | 316.91 | 242.51 | 195.6 | 262.43 | 307.99 | 596.7 | 1196.44 |
| 1991 | -9999 | -9999 | -9999 | -9999 | -9999 | -9999 | -9999 | -9999 | -9999 | -9999 | -9999 | -9999 | -9999 |
| |
|
|
|
|
|
|
|
|
|
|
|
|
|
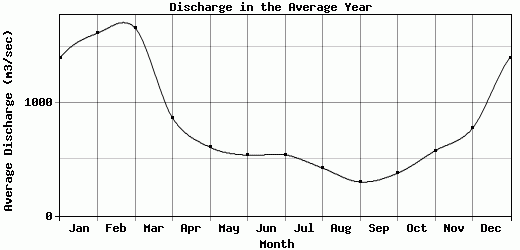
| Avg | 1400.76 | 1617.07 | 1664.61 | 866.59 | 606.45 | 535.22 | 540.21 | 422.33 | 299.05 | 376.15 | 574.54 | 774.21 | 806.43 |
| |
|
|
|
|
|
|
|
|
|
|
|
|
|
| Std Dev | 764.7 |
1012.86 |
1058.65 |
540.3 |
457.16 |
596.03 |
507.95 |
372.91 |
139.59 |
292.33 |
293.74 |
370.41 |
312.24 |
| |
|
|
|
|
|
|
|
|
|
|
|
|
|
| | Jan | Feb | Mar | Apr | May | Jun | Jul | Aug | Sep | Oct | Nov | Dec | Avg Annual |
Click here for this table in tab-delimited format.
Tab-delimited format will open in most table browsing software, i.e. Excel, etc.
View this station on the map.
Return to start.