Results
| Country: | Japan
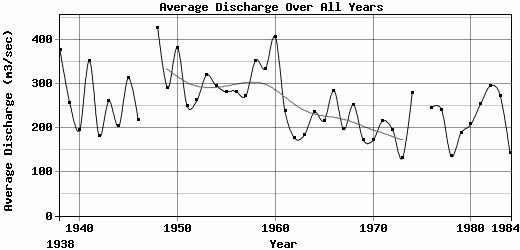
| | Station: | Kirihashi | | River: | Tone | | Area: | 8588 km2 | | Lat: | 36.13 | | Lon: | 139.7 | | Source: | RivDIS | | PointID: | 172 | | Area Units: | km2 | | Discharge Units: | m3/sec | | Starting Year: | 1938 | | Ending Year: | 1984 | | Total Years: | 47 | | Total Usable Years: | 45 | |
| |
| Year | Jan | Feb | Mar | Apr | May | Jun | Jul | Aug | Sep | Oct | Nov | Dec | Avg Annual |
|---|
| 1938 | 108.7 | 108.1 | 189.3 | 259.4 | 327.4 | 495.4 | 777.5 | 634.8 | 851.2 | 406.7 | 218 | 137.5 | 376.17 |
| 1939 | 103.1 | 97.5 | 133.7 | 366.8 | 345 | 184.3 | 232.5 | 778.1 | 263.3 | 250.1 | 189.8 | 125.8 | 255.83 |
| 1940 | 85.1 | 84.7 | 104.8 | 234.2 | 212 | 153.8 | 140.7 | 396.4 | 446.7 | 199.8 | 146.8 | 119.7 | 193.73 |
| 1941 | 99 | 86 | 126 | 177 | 217 | 328 | 1242 | 700 | 472 | 405 | 172 | 183 | 350.58 |
| 1942 | 117 | 110 | 225 | 217 | 245 | 138 | 138 | 212 | 256 | 270 | 137 | 101 | 180.5 |
| 1943 | 85.8 | 88 | 81.8 | 158.9 | 222.6 | 175.1 | 272.8 | 305.8 | 672.1 | 761.6 | 173.3 | 114.1 | 259.33 |
| 1944 | 84 | 80 | 93 | 192 | 325 | 155 | 153 | 227 | 329 | 507 | 178 | 108 | 202.58 |
| 1945 | 94 | 99 | 128 | 287 | 280 | 352 | 429 | 379 | 339 | 950 | 252 | 156 | 312.08 |
| 1946 | 112 | 105 | 134 | 312 | 250 | 154 | 180 | 575 | 133 | 279 | 202 | 158 | 216.17 |
| 1947 | -9999 | -9999 | -9999 | -9999 | -9999 | -9999 | -9999 | -9999 | -9999 | -9999 | -9999 | -9999 | -9999 |
| 1948 | 169 | 162 | 190 | 352 | 277 | 472 | 803 | 814 | 1032 | 402 | 244 | 197 | 426.17 |
| 1949 | 172 | 143 | 139 | 204 | 251 | 321 | 274 | 236 | 905 | 322 | 280 | 233 | 290 |
| 1950 | 148.8 | 184.8 | 144.1 | 400.8 | 278.7 | 777.3 | 590.9 | 1054.7 | 233.4 | 237.4 | 260.2 | 261 | 381.01 |
| 1951 | 134 | 123 | 272.4 | 530 | 240.3 | 187.1 | 384.1 | 204.7 | 271.2 | 241.9 | 244.9 | 150 | 248.63 |
| 1952 | 150.5 | 126.8 | 189.8 | 422.8 | 335.9 | 276.5 | 487.4 | 295.1 | 200.2 | 259.7 | 223.6 | 169.6 | 261.49 |
| 1953 | 120.5 | 112.7 | 163.5 | 184.1 | 272.5 | 513.3 | 812.8 | 397.2 | 566.5 | 363.3 | 160.5 | 161.7 | 319.05 |
| 1954 | 129.4 | 133.3 | 186.8 | 353.3 | 276.2 | 582.2 | 459.1 | 176.1 | 604.2 | 286.5 | 181.4 | 154.7 | 293.6 |
| 1955 | 110.3 | 115.7 | 223.2 | 314.7 | 344.1 | 155.8 | 183.7 | 283.3 | 419.5 | 727.8 | 329.5 | 166.8 | 281.2 |
| 1956 | 131.7 | 118.5 | 213.1 | 356.1 | 405.8 | 239.7 | 437.3 | 124 | 371.9 | 502.8 | 333.2 | 147.2 | 281.77 |
| 1957 | 110.6 | 113.5 | 109.3 | 231.4 | 216.1 | 235 | 532.2 | 480.8 | 551.2 | 371.9 | 172.3 | 139.5 | 271.98 |
| 1958 | 110.6 | 116.1 | 143.2 | 198.9 | 139.8 | 769.3 | 301.8 | 364.4 | 1147.8 | 530.6 | 226.4 | 178.2 | 352.26 |
| 1959 | 161.6 | 183.6 | 178.9 | 268.2 | 207.2 | 298.7 | 313.2 | 930.9 | 512.3 | 460.7 | 290.5 | 190.5 | 333.03 |
| 1960 | 194.8 | 194.8 | 305.2 | 1092.6 | 1035.7 | 443.3 | 238.1 | 275.1 | 273.6 | 220.8 | 265.6 | 326.5 | 405.51 |
| 1961 | 108 | 99.1 | 124.5 | 265 | 161.8 | 356.8 | 316.9 | 171.1 | 171.9 | 591.5 | 310.3 | 171.1 | 237.33 |
| 1962 | 117.6 | 104.4 | 104.3 | 210.9 | 191.1 | 346 | 413.7 | 121.1 | 123 | 136 | 145.6 | 97.1 | 175.9 |
| 1963 | 113.3 | 104 | 126.2 | 247.1 | 190.8 | 239.2 | 284.5 | 145.1 | 182.4 | 201.9 | 214.7 | 148.5 | 183.14 |
| 1964 | 118 | 141 | 132.1 | 407.2 | 132 | 95.1 | 352.5 | 305.3 | 422.7 | 374.3 | 201.3 | 131.6 | 234.43 |
| 1965 | 117 | 102 | 90 | 118 | 432 | 514 | 194 | 219 | 382 | 134 | 155 | 124 | 215.08 |
| 1966 | 103 | 94 | 225 | 255 | 218 | 507 | 420 | 125 | 882 | 310 | 153 | 110 | 283.5 |
| 1967 | 90 | 102 | 128 | 229 | 194 | 146 | 391 | 111 | 371 | 290 | 177 | 118 | 195.58 |
| 1968 | 87 | 80.5 | 124 | 221 | 328 | 276 | 491 | 609 | 294 | 202 | 108 | 202 | 251.88 |
| 1969 | 93 | 142 | 122 | 204 | 129 | 120 | 261 | 260 | 277 | 211 | 144 | 99.5 | 171.88 |
| 1970 | 78 | 114 | 102 | 170 | 277 | 210 | 285 | 169 | 205 | 169 | 166 | 104 | 170.75 |
| 1971 | 74 | 70 | 92 | 176 | 215 | 147 | 247 | 152 | 893 | 261 | 159 | 95.5 | 215.13 |
| 1972 | 110 | 126 | 131 | 228 | 111 | 77 | 411 | 127 | 706 | 139 | 86 | 83 | 194.58 |
| 1973 | 88 | 95 | 81 | 216 | 173 | 233 | 159 | 69 | 134 | 129 | 107 | 73 | 129.75 |
| 1974 | 68 | 83 | 218 | 274 | 159 | 391 | 622 | 416 | 712 | 180 | 120 | 94 | 278.08 |
| 1975 | -9999 | -9999 | -9999 | -9999 | -9999 | -9999 | -9999 | -9999 | -9999 | -9999 | -9999 | -9999 | -9999 |
| 1976 | 90.5 | 85 | 117 | 164 | 283 | 402 | 301 | 269 | 689 | 282 | 151 | 110 | 245.29 |
| 1977 | 84.5 | 75 | 115 | 239 | 134 | 276 | 356 | 652 | 565 | 199 | 110 | 84 | 240.79 |
| 1978 | 82 | 74 | 84.5 | 177 | 211 | 160 | 231 | 71.5 | 174 | 147 | 120 | 88.5 | 135.04 |
| 1979 | 63 | 102 | 86 | 125 | 288 | 82.5 | 147 | 169 | 125 | 624 | 252 | 188 | 187.63 |
| 1980 | 98 | 87 | 104 | 202 | 194 | 105 | 285 | 432 | 375 | 300 | 167 | 134 | 206.92 |
| 1981 | 77 | 76.5 | 128 | 191 | 335 | 226 | 432 | 653 | 327 | 310 | 169 | 114 | 253.21 |
| 1982 | 92 | 88 | 108 | 185 | 143 | 163 | 178 | 955 | 1001 | 301 | 164 | 157 | 294.58 |
| 1983 | 114 | 119 | 147 | 315 | 157 | 128 | 403 | 752 | 494 | 369 | 159 | 112 | 272.42 |
| 1984 | 99 | 81 | 82 | 194 | 247 | 210 | 320 | 135 | 100 | 107 | 69.5 | 67.5 | 142.67 |
| |
|
|
|
|
|
|
|
|
|
|
|
|
|
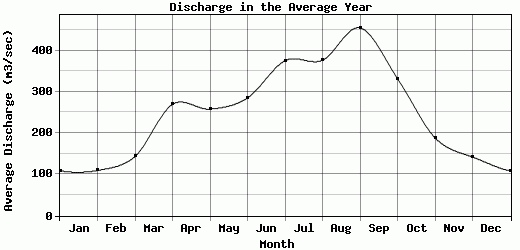
| Avg | 108.83 | 109.57 | 143.24 | 269.48 | 257.96 | 284.83 | 375.22 | 376.28 | 454.6 | 331.65 | 188.65 | 141.89 | 253.52 |
| |
|
|
|
|
|
|
|
|
|
|
|
|
|
| Std Dev | 28.24 |
29.28 |
52.15 |
150.16 |
138.88 |
168.93 |
212.46 |
260.64 |
273.78 |
179.49 |
62.41 |
50.13 |
70.26 |
| |
|
|
|
|
|
|
|
|
|
|
|
|
|
| | Jan | Feb | Mar | Apr | May | Jun | Jul | Aug | Sep | Oct | Nov | Dec | Avg Annual |
Click here for this table in tab-delimited format.
Tab-delimited format will open in most table browsing software, i.e. Excel, etc.
View this station on the map.
Return to start.