Results
| Country: | Burkina_Faso
| | Station: | Dapola | | River: | BlackVolta | | Area: | 66540 km2 | | Lat: | 10.57 | | Lon: | -2.92 | | Source: | RivDIS | | PointID: | 1543 | | Area Units: | km2 | | Discharge Units: | m3/sec | | Starting Year: | 1951 | | Ending Year: | 1989 | | Total Years: | 39 | | Total Usable Years: | 37 | |
| |
| Year | Jan | Feb | Mar | Apr | May | Jun | Jul | Aug | Sep | Oct | Nov | Dec | Avg Annual |
|---|
| 1951 | -9999 | -9999 | 11.4 | 10.9 | 24.4 | 62.2 | 103 | 222 | 521 | 840 | 486 | 148 | -9999 |
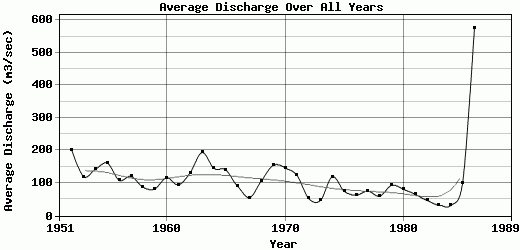
| 1952 | 90.3 | 51.2 | 33.5 | 20.9 | 21.3 | 31.5 | 87.1 | 220 | 625 | 836 | 270 | 116 | 200.23 |
| 1953 | 56.8 | 32.9 | 30.5 | 14.5 | 21.1 | 52.6 | 101 | 226 | 539 | 234 | 82.02 | 44.2 | 119.55 |
| 1954 | 22 | 12 | 6.85 | 4.52 | 6.34 | 36.4 | 42.3 | 174 | 678 | 463 | 163 | 102 | 142.53 |
| 1955 | 70.1 | 38.4 | 21.4 | 15.2 | 16.3 | 25.4 | 70.5 | 252 | 561 | 591 | 166 | 106 | 161.11 |
| 1956 | 72 | 41.5 | 19.1 | 14.3 | 10.6 | 30.6 | 62.8 | 107 | 452 | 311 | 107 | 72.7 | 108.38 |
| 1957 | 42.2 | 20.9 | 10.3 | 21.6 | 30.3 | 55.4 | 92.6 | 211 | 404 | 372 | 120 | 67 | 120.61 |
| 1958 | 36.4 | 19.8 | 12.4 | 9.1 | 7.1 | 27.3 | 57.6 | 144 | 308 | 234 | 104 | 90.6 | 87.53 |
| 1959 | 57.5 | 34.8 | 17.8 | 8.78 | 31.5 | 26.5 | 37 | 146 | 362 | 151 | 68.8 | 42.7 | 82.03 |
| 1960 | 20.4 | 12 | 9.5 | 10.4 | 30.7 | 64.6 | 135 | 293 | 460 | 223 | 80.6 | 53.6 | 116.07 |
| 1961 | 23.8 | 13.2 | 9.26 | 6.77 | 16 | 46.1 | 54.6 | 156 | 412 | 217 | 104 | 75 | 94.48 |
| 1962 | 42.4 | 23.1 | 11.6 | 16.4 | 24.4 | 32.6 | 49.4 | 208 | 576 | 418 | 122 | 59.8 | 131.98 |
| 1963 | 23.8 | 12.9 | 4.95 | 6.66 | 33.3 | 15.4 | 108 | 755 | 782 | 375 | 130 | 77.8 | 193.73 |
| 1964 | 44.4 | 19.7 | 9.14 | 9.38 | 16.5 | 31.1 | 53.7 | 173 | 616 | 548 | 138 | 84.6 | 145.29 |
| 1965 | 51.3 | 32.5 | 15 | 12.5 | 14.5 | 31.9 | 94.6 | 395 | 488 | 350 | 124 | 73.6 | 140.24 |
| 1966 | 37.6 | 17.2 | 12.6 | 11.3 | 30.2 | 18.3 | 25.3 | 174 | 297 | 305 | 112 | 44.9 | 90.45 |
| 1967 | 18.4 | 9.84 | 7.61 | 8.01 | 8.83 | 14.4 | 35.8 | 129 | 0.34 | 274 | 103 | 53 | 55.19 |
| 1968 | 21.6 | 12.7 | 8.41 | 10.6 | 24.4 | 70.7 | 99.7 | 152 | 363 | 313 | 133 | 70.4 | 106.63 |
| 1969 | 32.9 | 15.3 | 8.94 | 15 | 16.3 | 37 | 142 | 355 | 622 | 384 | 149 | 71 | 154.04 |
| 1970 | 31.9 | 15.7 | 8.69 | 8.13 | 12.3 | 19.9 | 56.1 | 380 | 674 | 362 | 113 | 80.4 | 146.84 |
| 1971 | 45.5 | 24.1 | 12.1 | 11 | 18.5 | 32.2 | 75.1 | 278 | 591 | 289 | 80.5 | 35.3 | 124.36 |
| 1972 | 15.2 | 7.82 | 6.13 | 10.7 | 25.6 | 69.8 | 44.5 | 132 | 205 | 80 | 26.4 | 10.3 | 52.79 |
| 1973 | 6.71 | 5 | 4.3 | 6.29 | 22.5 | 24.1 | 63.1 | 213 | 155 | 48.4 | 9.21 | 5.07 | 46.89 |
| 1974 | 3.5 | 2.4 | 1.56 | 4.43 | 13.1 | 24.6 | 134 | 272 | 568 | 287 | 85.3 | 35.9 | 119.32 |
| 1975 | 13.2 | 5.29 | 3.33 | 11.9 | 12.1 | 22.5 | 69.2 | 143 | 376 | 156 | 60.6 | 29 | 75.18 |
| 1976 | 10.7 | 5.57 | 3.38 | 3.72 | 11.4 | 49.8 | 55.3 | 86.3 | 143 | 184 | 168 | 34.7 | 62.99 |
| 1977 | 10.6 | 5.69 | 3.33 | 2.18 | 18.9 | 29.9 | 57.4 | 164 | 427 | 137 | 39.6 | 9.89 | 75.46 |
| 1978 | 5.23 | 3.57 | 2.92 | 7.17 | 29.2 | 23.4 | 102 | 151 | 183 | 127 | 55.9 | 26.9 | 59.77 |
| 1979 | 7.54 | 3.47 | 1.88 | 1.62 | 20.1 | 22.7 | 114 | 222 | 384 | 219 | 83.3 | 38.3 | 93.16 |
| 1980 | 11.5 | 6.5 | 2.61 | 1.79 | 16.5 | 44 | 46.2 | 226 | 435 | 117 | 50 | 15 | 81.01 |
| 1981 | 7.42 | 3.05 | 1.14 | 1.02 | 12.1 | 41.1 | 109 | 212 | 257 | 98.3 | 35.8 | 9.39 | 65.61 |
| 1982 | 4.41 | 2.69 | 5.98 | 11.2 | 32.6 | 37 | 28.3 | 122 | 186 | 79.7 | 40.1 | 12.3 | 46.86 |
| 1983 | 6.15 | 3.38 | 0.9 | 0.44 | 13.9 | 41.9 | 61.8 | 136 | 93.5 | 30.6 | 1.27 | 0 | 32.49 |
| 1984 | 0 | 0 | 0 | 0 | 37 | 54.2 | 50 | 50.1 | 64 | 83.1 | 35.7 | 2.44 | 31.38 |
| 1985 | 0 | 0 | 0 | 0.86 | 11.6 | 63.7 | 197 | 370 | 340 | 140 | 52.2 | 23.6 | 99.91 |
| 1986 | 1.56 | 0 | 0.2 | 0.93 | 11.7 | 50.7 | 68 | 160 | 421 | 6140 | 43.1 | 16.3 | 576.12 |
| 1987 | 3.87 | 2.77 | 0.1 | 2.23 | 1.56 | 56.9 | 59.2 | 31.8 | 270 | 84 | 18.1 | -9999 | -9999 |
| 1988 | 1.63 | 0.2 | -9999 | -9999 | -9999 | -9999 | 28.7 | 62.3 | 286 | 111 | 9.52 | 3.75 | -9999 |
| 1989 | 2.56 | 1.88 | 1.47 | -9999 | -9999 | -9999 | -9999 | -9999 | -9999 | -9999 | -9999 | -9999 | -9999 |
| |
|
|
|
|
|
|
|
|
|
|
|
|
|
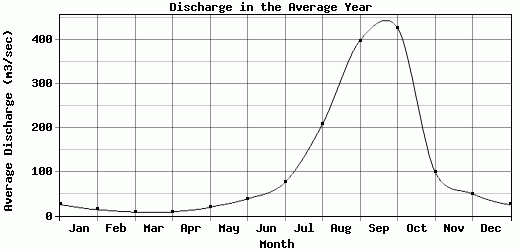
| Avg | 25.08 | 13.66 | 8.43 | 8.44 | 19.05 | 38.34 | 75.55 | 207.99 | 398.02 | 426.63 | 99.21 | 49.77 | 115.43 |
| |
|
|
|
|
|
|
|
|
|
|
|
|
|
| Std Dev | 22.86 |
12.94 |
7.8 |
5.6 |
8.58 |
15.73 |
36.55 |
124.27 |
186.17 |
958.21 |
83.73 |
35.8 |
89.48 |
| |
|
|
|
|
|
|
|
|
|
|
|
|
|
| | Jan | Feb | Mar | Apr | May | Jun | Jul | Aug | Sep | Oct | Nov | Dec | Avg Annual |
Click here for this table in tab-delimited format.
Tab-delimited format will open in most table browsing software, i.e. Excel, etc.
View this station on the map.
Return to start.