Results
| Country: | U.S.A.
| | Station: | GOODRICH, TX | | River: | TRINITY RIVER | | Area: | 43105.40 | | Lat: | 30.57 | | Lon: | -94.94 | | Source: | USGS | | PointID: | 8066250 | | Area Units: | km2 | | Discharge Units: | m3/sec | | Starting Year: | 1968 | | Ending Year: | 1993 | | Total Years: | 26 | | Total Usable Years: | 20 | |
| |
| Year | Jan | Feb | Mar | Apr | May | Jun | Jul | Aug | Sep | Oct | Nov | Dec | Avg Annual |
|---|
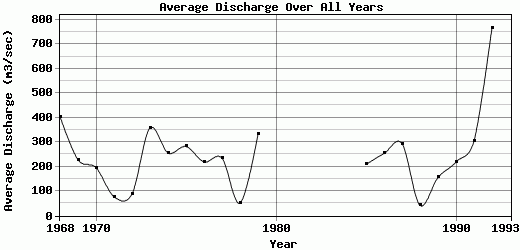
| 1968 | 531.32 | 382.09 | 440.13 | 477.9 | 1043.9 | 860.55 | 515.4 | 77.37 | 103.71 | 84.87 | 75.91 | 262.22 | 404.61 |
| 1969 | 85.86 | 306.04 | 409.29 | 634.79 | 728.97 | 191.07 | 64.33 | 32.6 | 43.27 | 36.06 | 73.89 | 138.31 | 228.71 |
| 1970 | 164.62 | 148.67 | 711.49 | 380.39 | 284.57 | 189.55 | 37.02 | 31.43 | 91.27 | 228.52 | 58.89 | 25.78 | 196.02 |
| 1971 | 31.68 | 16.88 | 14.11 | 15.29 | 32.54 | 10.4 | 6.97 | 79.31 | 96.92 | 104.98 | 165.55 | 355.33 | 77.5 |
| 1972 | 213.25 | 120.93 | 52.56 | 18.16 | 231.26 | 58.25 | 36.64 | 37.58 | 31.73 | 35.32 | 143.76 | 81.11 | 88.38 |
| 1973 | 219.78 | 275.31 | 438.05 | 628.97 | 414.01 | 789.31 | 181.92 | 66.28 | 128.82 | 686.48 | 263.73 | 201.28 | 357.83 |
| 1974 | 362.14 | 236.4 | 94.56 | 53.73 | 135.22 | 20 | 13.69 | 29.74 | 548.47 | 200.25 | 950.88 | 427.3 | 256.03 |
| 1975 | 320.46 | 660.65 | 257.28 | 283.84 | 634.77 | 635.3 | 242.52 | 124.44 | 67.35 | 52.21 | 52.79 | 54.78 | 282.2 |
| 1976 | 49.8 | 54.13 | 62.52 | 270.68 | 507.23 | 324.11 | 353.08 | 82.47 | 64.4 | 152.39 | 182.26 | 529.98 | 219.42 |
| 1977 | 180.14 | 540.66 | 215.77 | 907.68 | 539.48 | 211.81 | 42.2 | 38.69 | 54.78 | 29.33 | 26.73 | 26.37 | 234.47 |
| 1978 | 91.73 | 118.37 | 77.73 | 16 | 8.83 | 45.59 | 12.37 | 40.27 | 68.11 | 19.2 | 59.37 | 53.43 | 50.92 |
| 1979 | 294.05 | 308.44 | 368.68 | 522.06 | 720.08 | 948.02 | 233.34 | 190.38 | 211.03 | 51.27 | 46.17 | 87.85 | 331.78 |
| 1980 | -9999 | -9999 | -9999 | -9999 | -9999 | -9999 | -9999 | -9999 | -9999 | -9999 | -9999 | -9999 | -9999 |
| 1981 | -9999 | -9999 | -9999 | -9999 | -9999 | -9999 | -9999 | -9999 | -9999 | -9999 | -9999 | -9999 | -9999 |
| 1982 | -9999 | -9999 | -9999 | -9999 | -9999 | -9999 | -9999 | -9999 | -9999 | -9999 | -9999 | -9999 | -9999 |
| 1983 | -9999 | -9999 | -9999 | -9999 | -9999 | -9999 | -9999 | -9999 | -9999 | -9999 | -9999 | -9999 | -9999 |
| 1984 | -9999 | -9999 | -9999 | -9999 | -9999 | -9999 | -9999 | -9999 | -9999 | -9999 | -9999 | -9999 | -9999 |
| 1985 | 283.16 | 262.58 | 436.64 | 174.76 | 202.67 | 108.54 | 38.81 | 16.87 | 26.43 | 94.42 | 320.25 | 539.11 | 208.69 |
| 1986 | 124.12 | 440.3 | 93.13 | 43.6 | 281.54 | 546.46 | 153.78 | 81.81 | 148.43 | 271.01 | 263.33 | 599.35 | 253.91 |
| 1987 | 379.29 | 297.83 | 537.02 | 211.44 | 105.98 | 1161.37 | 410.17 | 149.45 | 66.2 | 39.51 | 64.8 | 105.65 | 294.06 |
| 1988 | 97.75 | 59.51 | 102.62 | 52.25 | 24.72 | 58.6 | 35.68 | 21.11 | 14.28 | 10.44 | 8.21 | 24.52 | 42.47 |
| 1989 | 44.56 | 93.01 | 61.9 | 124.25 | 409.34 | 683.01 | 170.82 | 159.42 | 34.63 | 31.72 | 28.72 | 25.47 | 155.57 |
| 1990 | 36.15 | 80.46 | 245.15 | 274.94 | 1114.87 | 596.07 | 94.23 | 30.58 | 37.32 | 42.12 | 50.03 | 29.68 | 219.3 |
| 1991 | 685.05 | 368.3 | 144.75 | 479.77 | 369.37 | 349.04 | 69.26 | 62.16 | 84.83 | 53.12 | 324.3 | 661.38 | 304.28 |
| 1992 | 1998.18 | 1714.15 | 1703.86 | 839.03 | 740.72 | 1071.42 | 440.74 | 245.49 | 106.74 | 49.55 | 88.22 | 202.8 | 766.74 |
| 1993 | -9999 | -9999 | -9999 | -9999 | -9999 | -9999 | -9999 | -9999 | -9999 | -9999 | -9999 | -9999 | -9999 |
| |
|
|
|
|
|
|
|
|
|
|
|
|
|
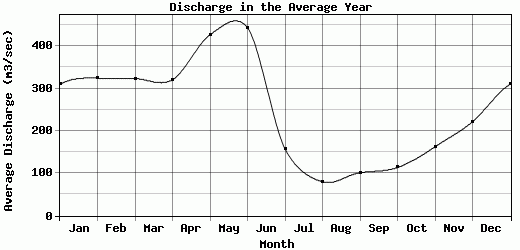
| Avg | 309.65 | 324.24 | 323.36 | 320.48 | 426.5 | 442.92 | 157.65 | 79.87 | 101.44 | 113.64 | 162.39 | 221.58 | 248.64 |
| |
|
|
|
|
|
|
|
|
|
|
|
|
|
| Std Dev | 422.6 |
359.91 |
369.11 |
271.71 |
316.69 |
369.11 |
154.98 |
61.36 |
112.33 |
149.66 |
205.42 |
212.05 |
153.28 |
| |
|
|
|
|
|
|
|
|
|
|
|
|
|
| | Jan | Feb | Mar | Apr | May | Jun | Jul | Aug | Sep | Oct | Nov | Dec | Avg Annual |
Click here for this table in tab-delimited format.
Tab-delimited format will open in most table browsing software, i.e. Excel, etc.
View this station on the map.
Return to start.