Results
| Country: | U.S.A.
| | Station: | LIBERTY, TX | | River: | TRINITY RIVER | | Area: | 45239.44 | | Lat: | 30.05 | | Lon: | -94.82 | | Source: | USGS | | PointID: | 8067000 | | Area Units: | km2 | | Discharge Units: | m3/sec | | Starting Year: | 1956 | | Ending Year: | 1993 | | Total Years: | 38 | | Total Usable Years: | 37 | |
| |
| Year | Jan | Feb | Mar | Apr | May | Jun | Jul | Aug | Sep | Oct | Nov | Dec | Avg Annual |
|---|
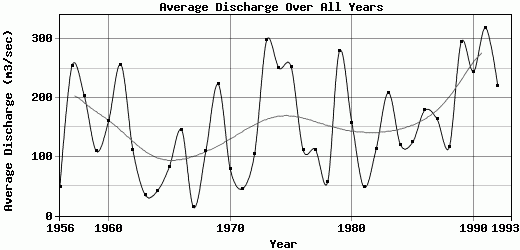
| 1956 | 21.57 | 173.31 | 62.85 | 109.2 | 179.97 | 12.34 | 5.95 | 2.84 | 2.24 | 2.06 | 8.17 | 9.84 | 49.2 |
| 1957 | 12.59 | 99.77 | 123.01 | 325.01 | 1056.22 | 478.18 | 73.55 | 13.47 | 10.91 | 104.75 | 441.56 | 324.24 | 255.27 |
| 1958 | 309.87 | 226.09 | 186.97 | 158.24 | 800.46 | 136.45 | 76.32 | 53.28 | 270.59 | 131.71 | 50.38 | 44.43 | 203.73 |
| 1959 | 37.91 | 189.49 | 167.13 | 255.14 | 210.38 | 85.08 | 39.57 | 40.91 | 14.09 | 66.87 | 47.7 | 158.47 | 109.4 |
| 1960 | 356.94 | 359.09 | 364.77 | 76.32 | 59.31 | 45.25 | 52.15 | 24.33 | 22.4 | 41.16 | 92.93 | 434.36 | 160.75 |
| 1961 | 688.29 | 421.64 | 477.79 | 371.78 | 47.28 | 104.22 | 137.31 | 38.22 | 187.82 | 28.31 | 70.34 | 509.41 | 256.87 |
| 1962 | 257.79 | 229.74 | 208.23 | 144.1 | 255.32 | 54.55 | 28.28 | 13.91 | 27.22 | 17.73 | 19.33 | 73.47 | 110.81 |
| 1963 | 68.56 | 68.49 | 63.58 | 49.8 | 108.65 | 17.39 | 11.56 | 8.95 | 4.83 | 3.09 | 5.37 | 15.54 | 35.48 |
| 1964 | 33.71 | 36.24 | 135.94 | 151.36 | 73.17 | 23.77 | 4.7 | 6.16 | 4.43 | 5.86 | 4.54 | 21.26 | 41.76 |
| 1965 | 28.36 | 128.32 | 139.64 | 171.27 | 156.35 | 252.06 | 21.43 | 6.86 | 15.06 | 9.34 | 7.67 | 62.76 | 83.26 |
| 1966 | 67.61 | 395.84 | 66.11 | 84.05 | 908.06 | 144.19 | 12.72 | 13.62 | 21.14 | 4.88 | 2.54 | 27.59 | 145.7 |
| 1967 | 31.14 | 32.53 | 28.62 | 19.6 | 13.33 | 13.69 | 8.28 | 2.6 | 2.2 | 2.34 | 2.44 | 6.99 | 13.65 |
| 1968 | 13.71 | 7.54 | 13.74 | 51.14 | 159.18 | 311.39 | 110.57 | 61.87 | 113.65 | 55.65 | 40.27 | 382.27 | 110.08 |
| 1969 | 162.08 | 165.42 | 628.09 | 751.16 | 516.84 | 196.48 | 59.71 | 77.11 | 77.46 | 9.18 | 23.52 | 13.96 | 223.42 |
| 1970 | 24.31 | 53.88 | 243.73 | 237.73 | 147.01 | 11.32 | 70.07 | 26.81 | 62.59 | 16.72 | 14.58 | 43.18 | 79.33 |
| 1971 | 70.15 | 48.23 | 38.97 | 6.54 | 22.63 | 42.66 | 25.4 | 19.58 | 12.72 | 13.03 | 14.46 | 232.08 | 45.54 |
| 1972 | 379.11 | 165.1 | 25.78 | 35.1 | 110.32 | 69.47 | 61.51 | 133.09 | 132.65 | 15.5 | 13.03 | 112.24 | 104.41 |
| 1973 | 341.69 | 251.8 | 387.93 | 553.5 | 525.44 | 335.1 | 227.81 | 119.1 | 154.76 | 49.93 | 190.76 | 441.87 | 298.31 |
| 1974 | 807.4 | 473.42 | 169.05 | 179.16 | 206.34 | 138.36 | 135.1 | 135.07 | 114.93 | 12.13 | 132.6 | 507.88 | 250.95 |
| 1975 | 474.99 | 607.91 | 445.58 | 275.13 | 496.76 | 274.41 | 168.9 | 139.28 | 125.28 | 15.74 | 6.22 | 9.15 | 253.28 |
| 1976 | 17.71 | 69.73 | 153.61 | 113.09 | 167.46 | 233.18 | 187.54 | 188.66 | 121.46 | 13.64 | 18.05 | 47.4 | 110.96 |
| 1977 | 91.17 | 168 | 265.38 | 257.15 | 108.83 | 90.25 | 76.34 | 118.41 | 120.15 | 6.41 | 37.02 | 8.7 | 112.32 |
| 1978 | 24.81 | 139.47 | 123.02 | 8.55 | 59.87 | 60.68 | 59.92 | 50.47 | 74.89 | 7.48 | 7.48 | 60.58 | 56.44 |
| 1979 | 387.45 | 542.88 | 510.36 | 557.56 | 415.92 | 391.53 | 94.32 | 105.43 | 125.69 | 9.9 | 46.84 | 173.54 | 280.12 |
| 1980 | 145.43 | 321.79 | 214.98 | 463.69 | 413.77 | 83.15 | 79.35 | 52.74 | 68.23 | 14.1 | 22.92 | 15.71 | 157.99 |
| 1981 | 21.55 | 11.96 | 14.34 | 25.71 | 56.09 | 70.17 | 131.96 | 150.74 | 23.59 | 19.95 | 24.81 | 27.45 | 48.19 |
| 1982 | 24.02 | 150.83 | 48.06 | 178.92 | 197.92 | 60.47 | 91.81 | 100.99 | 24.07 | 32.85 | 37.95 | 413.02 | 113.41 |
| 1983 | 427.22 | 455.43 | 440.74 | 148.43 | 319.22 | 199.68 | 155.74 | 66.78 | 17.31 | 25.17 | 30.82 | 222.76 | 209.11 |
| 1984 | 160.47 | 212.09 | 422.29 | 36.02 | 17.68 | 106.5 | 99.4 | 27.3 | 25.23 | 68.01 | 106.2 | 163.22 | 120.37 |
| 1985 | 162.64 | 188.71 | 346.15 | 122.26 | 136.18 | 89.43 | 100.71 | 48.95 | 39.87 | 33.43 | 21.88 | 207.33 | 124.8 |
| 1986 | 320.71 | 286.99 | 48.85 | 65.39 | 69.27 | 462.59 | 225.4 | 87.32 | 34.13 | 101.63 | 163.24 | 286.33 | 179.32 |
| 1987 | 381.93 | 209.03 | 437.45 | 216.44 | 56.34 | 59.78 | 131.9 | 87.89 | 26.18 | 26.96 | 43 | 293.19 | 164.17 |
| 1988 | 427.77 | 220.35 | 302.31 | 135.66 | 53.44 | 60.76 | 33.38 | 41.03 | 38.89 | 21.71 | 23.5 | 31.83 | 115.89 |
| 1989 | 242.48 | 376.15 | 280.92 | 365.83 | 540.61 | 716.79 | 672.42 | 120.27 | 118.33 | 46.63 | 20.45 | 44.95 | 295.49 |
| 1990 | 179.23 | 462.68 | 440.56 | 429.29 | 610.28 | 391.14 | 125.73 | 130.69 | 35.53 | 31.73 | 29.35 | 71 | 244.77 |
| 1991 | 496.05 | 471.07 | 462.21 | 569.41 | 670.07 | 190.01 | 66.81 | 129.19 | 201.01 | 193.87 | 164.73 | 217.1 | 319.29 |
| 1992 | 398.08 | 494.57 | 621.51 | 265.8 | 54.1 | 114.86 | 163.87 | 148.88 | 86.95 | 35.39 | 87.18 | 170.29 | 220.12 |
| 1993 | -9999 | -9999 | -9999 | -9999 | -9999 | -9999 | -9999 | -9999 | -9999 | -9999 | -9999 | -9999 | -9999 |
| |
|
|
|
|
|
|
|
|
|
|
|
|
|
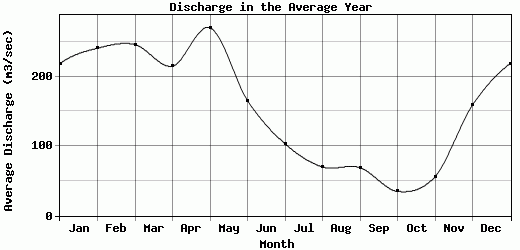
| Avg | 218.82 | 240.96 | 246.22 | 215.26 | 270.27 | 165.6 | 103.45 | 70.08 | 69.15 | 35 | 56.05 | 159.06 | 154.16 |
| |
|
|
|
|
|
|
|
|
|
|
|
|
|
| Std Dev | 202.65 |
163.89 |
179.6 |
181.39 |
267.01 |
157.84 |
111.79 |
52 |
64.27 |
40 |
80.33 |
156.15 |
84.67 |
| |
|
|
|
|
|
|
|
|
|
|
|
|
|
| | Jan | Feb | Mar | Apr | May | Jun | Jul | Aug | Sep | Oct | Nov | Dec | Avg Annual |
Click here for this table in tab-delimited format.
Tab-delimited format will open in most table browsing software, i.e. Excel, etc.
View this station on the map.
Return to start.