Results
| Country: | U.S.A.
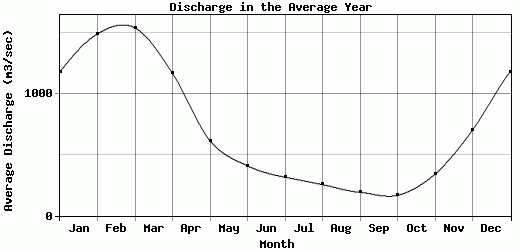
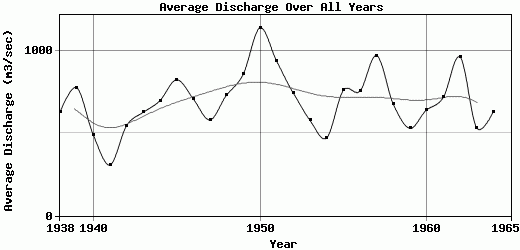
| | Station: | MIDWAY, TEX. (DISC) | | River: | TRINITY RIVER | | Area: | 37423.28 | | Lat: | 31.07 | | Lon: | -95.69 | | Source: | USGS | | PointID: | 8065500 | | Area Units: | km2 | | Discharge Units: | m3/sec | | Starting Year: | 1938 | | Ending Year: | 1965 | | Total Years: | 28 | | Total Usable Years: | 27 | |
| |
| Year | Jan | Feb | Mar | Apr | May | Jun | Jul | Aug | Sep | Oct | Nov | Dec | Avg Annual |
|---|
| 1938 | 1229.41 | 1091.72 | 1372.92 | 907.94 | 502.75 | 609.97 | 371.26 | 616.44 | 190.96 | 52.8 | 272.97 | 303.93 | 626.92 |
| 1939 | 1192.51 | 3690.11 | 1757.75 | 1407.92 | 388.7 | 310.73 | 259.33 | 160.64 | 29.36 | 30.7 | 29.97 | 67.47 | 777.1 |
| 1940 | 105.83 | 792.14 | 1446.54 | 1946.42 | 551.68 | 326.19 | 245.18 | 102.89 | 98.66 | 27.32 | 69.5 | 161.16 | 489.46 |
| 1941 | 388.16 | 229.88 | 472.56 | 776.19 | 162.85 | 192.17 | 865.37 | 148.05 | 76.4 | 24.54 | 74.89 | 289.44 | 308.38 |
| 1942 | 525.79 | 992.81 | 1316.74 | 687.05 | 176.69 | 159.91 | 248.86 | 609.24 | 134.36 | 73.02 | 417.76 | 1218.82 | 546.75 |
| 1943 | 1482.61 | 1119.74 | 2222.15 | 1172.42 | 704.82 | 264.89 | 102.41 | 123.12 | 96.44 | 35.22 | 82.86 | 123.98 | 627.55 |
| 1944 | 544.1 | 1514.39 | 2432.98 | 1562.06 | 479.19 | 118.18 | 36.02 | 97.81 | 354.91 | 488.12 | 223.07 | 527.97 | 698.23 |
| 1945 | 2188.54 | 1667.16 | 1870.75 | 713.31 | 1171.41 | 408.97 | 116.03 | 94.33 | 43.45 | 36.61 | 628.85 | 961.32 | 825.06 |
| 1946 | 2594.2 | 1740.08 | 1432.02 | 567.88 | 509.76 | 464.26 | 141.33 | 117.58 | 73.86 | 82.46 | 330.65 | 447.61 | 708.47 |
| 1947 | 2284.54 | 859.42 | 845.95 | 935.22 | 705.25 | 247.87 | 506.76 | 191.2 | 79.59 | 64.84 | 94.68 | 163.8 | 581.59 |
| 1948 | 445.54 | 2675.9 | 1847.91 | 1244.15 | 169.79 | 85.42 | 143.03 | 95.16 | 30.97 | 20.13 | 450.12 | 1582.92 | 732.59 |
| 1949 | 2146.7 | 1847.68 | 1426.81 | 1178.18 | 575.44 | 723.73 | 507.35 | 267.76 | 123.22 | 118.67 | 321.64 | 1071.92 | 859.09 |
| 1950 | 3040.7 | 3797.82 | 1296.37 | 601.01 | 1027.61 | 920.87 | 513.91 | 376.84 | 573.22 | 135.53 | 632.92 | 764.74 | 1140.13 |
| 1951 | 1264.86 | 1990.68 | 1376.39 | 1713.46 | 476.13 | 267.11 | 305.26 | 109.96 | 132.05 | 209.56 | 878.3 | 2520.85 | 937.05 |
| 1952 | 2021.74 | 1608.6 | 2080.11 | 1031.21 | 463.99 | 702.73 | 233.4 | 119.7 | 95.91 | 82.33 | 92.38 | 388.42 | 743.38 |
| 1953 | 863.3 | 1020.93 | 1263.49 | 917 | 1036.83 | 673.38 | 261.87 | 300.83 | 128.14 | 74.02 | 130.64 | 270.14 | 578.38 |
| 1954 | 1103.36 | 687.4 | 782.01 | 739.07 | 605.44 | 276.91 | 122.94 | 156.39 | 162.03 | 176.4 | 242.02 | 613.39 | 472.28 |
| 1955 | 784.82 | 1447 | 2224.44 | 1793.41 | 640.83 | 534.3 | 177.03 | 176.17 | 248.8 | 259.9 | 399.77 | 439.99 | 760.54 |
| 1956 | 387.91 | 2733.57 | 1754.56 | 1462.48 | 652.46 | 287.66 | 189.01 | 205.87 | 215.09 | 173.02 | 238.51 | 772.94 | 756.09 |
| 1957 | 1303.4 | 2665.64 | 1277.64 | 1167.98 | 547.49 | 393.12 | 442.76 | 289.28 | 275.12 | 417.16 | 1283.08 | 1598.27 | 971.75 |
| 1958 | 1183.74 | 944.07 | 642.79 | 1235.28 | 1564.83 | 415.54 | 404.78 | 352.77 | 375.27 | 354.7 | 187.69 | 459.24 | 676.72 |
| 1959 | 611.06 | 782.26 | 595.11 | 788.44 | 369.96 | 396.44 | 187.71 | 368.36 | 267.42 | 322.27 | 551.05 | 1122.54 | 530.22 |
| 1960 | 1156.89 | 912.98 | 1283.86 | 808.83 | 419.64 | 482.02 | 701.26 | 490.61 | 393.75 | 238.97 | 328.16 | 488.24 | 642.1 |
| 1961 | 649.01 | 717.94 | 1866.09 | 1436.8 | 854.72 | 701.6 | 398.97 | 283.35 | 337.1 | 203.57 | 277.53 | 888.8 | 717.96 |
| 1962 | 1403.88 | 1555.21 | 2944.88 | 2550.51 | 750.08 | 459.85 | 313.96 | 241.25 | 212.82 | 326.75 | 356.16 | 438.82 | 962.85 |
| 1963 | 439.19 | 592.95 | 2118.93 | 861.88 | 370.02 | 366.98 | 427.94 | 481.38 | 216.54 | 140.08 | 206.47 | 182.12 | 533.71 |
| 1964 | 476.95 | 599.15 | 1635.9 | 1309.57 | 676 | 248.31 | 294.93 | 306 | 210.74 | 344.92 | 404.2 | 1073.67 | 631.7 |
| 1965 | -9999 | -9999 | -9999 | -9999 | -9999 | -9999 | -9999 | -9999 | -9999 | -9999 | -9999 | -9999 | -9999 |
| |
|
|
|
|
|
|
|
|
|
|
|
|
|
| Avg | 1178.47 | 1491.75 | 1540.28 | 1167.25 | 613.12 | 408.86 | 315.51 | 254.93 | 191.71 | 167.17 | 340.96 | 701.57 | 697.63 |
| |
|
|
|
|
|
|
|
|
|
|
|
|
|
| Std Dev | 750.33 |
906.78 |
578.84 |
456.87 |
307.69 |
202.93 |
187.13 |
152.12 |
128.1 |
132.35 |
270.37 |
553.29 |
175.04 |
| |
|
|
|
|
|
|
|
|
|
|
|
|
|
| | Jan | Feb | Mar | Apr | May | Jun | Jul | Aug | Sep | Oct | Nov | Dec | Avg Annual |
Click here for this table in tab-delimited format.
Tab-delimited format will open in most table browsing software, i.e. Excel, etc.
View this station on the map.
Return to start.