Results
| Country: | U.S.S.R.
| | Station: | Ado-Tymovo | | River: | Tym | | Area: | 3420 km2 | | Lat: | 51.26 | | Lon: | 142.71 | | Source: | RivDIS | | PointID: | 174 | | Area Units: | km2 | | Discharge Units: | m3/sec | | Starting Year: | 1965 | | Ending Year: | 1984 | | Total Years: | 20 | | Total Usable Years: | 20 | |
| |
| Year | Jan | Feb | Mar | Apr | May | Jun | Jul | Aug | Sep | Oct | Nov | Dec | Avg Annual |
|---|
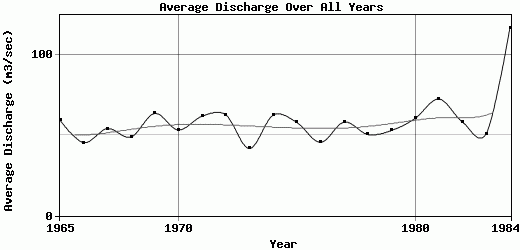
| 1965 | 12 | 10 | 10 | 31 | 189 | 151 | 37 | 29 | 116 | 87 | 24 | 17 | 59.42 |
| 1966 | 13 | 11 | 10 | 13 | 229 | 119 | 28 | 25 | 27 | 36 | 21 | 13 | 45.42 |
| 1967 | 9 | 8 | 8 | 56 | 193 | 71 | 63 | 55 | 85 | 60 | 25 | 17 | 54.17 |
| 1968 | 13 | 12 | 11 | 79 | 209 | 58 | 23 | 20 | 41 | 61 | 41 | 19 | 48.92 |
| 1969 | 13 | 9.6 | 9.4 | 19.5 | 220 | 158 | 77.5 | 68 | 50 | 63 | 54.5 | 20.5 | 63.58 |
| 1970 | 13 | 10.5 | 9.2 | 36.5 | 231 | 113 | 41 | 33 | 60 | 56.5 | 21.5 | 14.5 | 53.31 |
| 1971 | 11.5 | 9.6 | 9.4 | 17 | 293 | 152 | 40.5 | 34.5 | 46 | 79 | 31.5 | 18.5 | 61.88 |
| 1972 | 12 | 9.5 | 10 | 67.5 | 126 | 76 | 50.5 | 140 | 70.5 | 129 | 43.5 | 18.5 | 62.75 |
| 1973 | 12.5 | 9.5 | 10 | 11.5 | 177 | 80 | 37.5 | 64 | 34.5 | 28 | 22 | 15 | 41.79 |
| 1974 | 13 | 10.5 | 6.8 | 13.5 | 342 | 182 | 35.5 | 45 | 25 | 35.5 | 27 | 14.5 | 62.53 |
| 1975 | 11.5 | 9.1 | 8.6 | 63.5 | 259 | 114 | 26.5 | 39.5 | 80.5 | 48.5 | 20.5 | 15 | 58.02 |
| 1976 | 11 | 9.1 | 8.5 | 16 | 241 | 105 | 32 | 36 | 22 | 31 | 21 | 15 | 45.63 |
| 1977 | 12 | 9.3 | 9 | 14 | 273 | 163 | 34 | 34.5 | 27 | 67 | 38.5 | 17 | 58.19 |
| 1978 | 11 | 10 | 10 | 14 | 261 | 78 | 31 | 50 | 37 | 59 | 29 | 16 | 50.5 |
| 1979 | 10 | 10 | 10.5 | 19 | 178 | 60 | 28 | 65.5 | 154 | 55 | 26 | 20 | 53 |
| 1980 | 13.5 | 11.5 | 11 | 13 | 273 | 184 | 26 | 14.5 | 59 | 75.5 | 28 | 17 | 60.5 |
| 1981 | 14 | 11 | 9.4 | 31 | 222 | 70 | 34 | 51.5 | 82 | 237 | 82.5 | 26 | 72.53 |
| 1982 | 18.5 | 15 | 13 | 43.5 | 207 | 159 | 40.5 | 17 | 28.5 | 92.5 | 42 | 21.5 | 58.17 |
| 1983 | 16 | 12.5 | 10.5 | 45.5 | 188 | 130 | 26 | 29.5 | 30.5 | 74.5 | 30 | 19.5 | 51.04 |
| 1984 | 80 | 89 | 92 | 101 | 245 | 136 | 99 | 107 | 94 | 143 | 120 | 96 | 116.83 |
| |
|
|
|
|
|
|
|
|
|
|
|
|
|
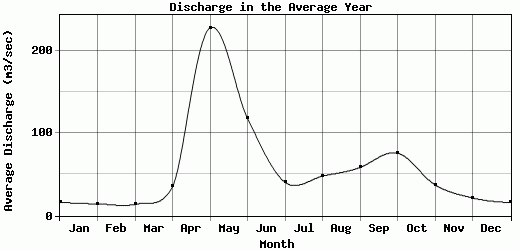
| Avg | 15.98 | 14.34 | 13.81 | 35.25 | 227.8 | 117.95 | 40.53 | 47.93 | 58.48 | 75.9 | 37.42 | 21.53 | 58.91 |
| |
|
|
|
|
|
|
|
|
|
|
|
|
|
| Std Dev | 14.82 |
17.19 |
17.98 |
25.36 |
47.19 |
40.6 |
18.61 |
29.91 |
34.11 |
46.79 |
23.83 |
17.34 |
15.13 |
| |
|
|
|
|
|
|
|
|
|
|
|
|
|
| | Jan | Feb | Mar | Apr | May | Jun | Jul | Aug | Sep | Oct | Nov | Dec | Avg Annual |
Click here for this table in tab-delimited format.
Tab-delimited format will open in most table browsing software, i.e. Excel, etc.
View this station on the map.
Return to start.