Results
| Country: | U.S.S.R.
| | Station: | Napas | | River: | Tym | | Area: | 24500 km2 | | Lat: | 59.9 | | Lon: | 81.91 | | Source: | RivDIS | | PointID: | 147 | | Area Units: | km2 | | Discharge Units: | m3/sec | | Starting Year: | 1965 | | Ending Year: | 1984 | | Total Years: | 20 | | Total Usable Years: | 20 | |
| |
| Year | Jan | Feb | Mar | Apr | May | Jun | Jul | Aug | Sep | Oct | Nov | Dec | Avg Annual |
|---|
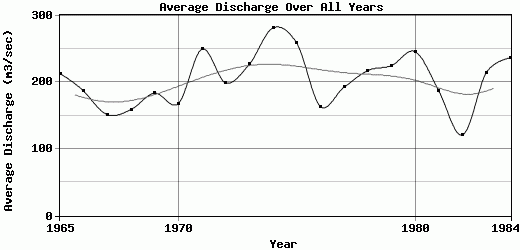
| 1965 | 65 | 64 | 63 | 66 | 388 | 705 | 307 | 233 | 289 | 209 | 97 | 75 | 213.42 |
| 1966 | 60 | 56 | 55 | 56 | 442 | 775 | 314 | 134 | 109 | 88 | 82 | 74 | 187.08 |
| 1967 | 62 | 57 | 58 | 103 | 708 | 274 | 137 | 105 | 89 | 90 | 76 | 60 | 151.58 |
| 1968 | 55 | 51 | 48 | 76 | 391 | 386 | 317 | 189 | 127 | 117 | 86 | 69 | 159.33 |
| 1969 | 59 | 52.5 | 47.5 | 50.5 | 232 | 797 | 285 | 174 | 165 | 130 | 129 | 85.5 | 183.92 |
| 1970 | 76 | 66.5 | 59 | 69 | 288 | 10 | 730 | 231 | 201 | 101 | 96.5 | 90 | 168.17 |
| 1971 | 70 | 64 | 61 | 76 | 665 | 854 | 270 | 158 | 235 | 267 | 166 | 115 | 250.08 |
| 1972 | 78.5 | 64 | 58 | 74.5 | 460 | 611 | 378 | 168 | 157 | 175 | 77 | 91.5 | 199.38 |
| 1973 | 74 | 66 | 64.5 | 69 | 443 | 933 | 300 | 210 | 162 | 190 | 125 | 92.3 | 227.4 |
| 1974 | 84 | 77.5 | 71.5 | 107 | 731 | 865 | 309 | 431 | 277 | 194 | 136 | 100 | 281.92 |
| 1975 | 78 | 76.5 | 70.5 | 78 | 320 | 873 | 333 | 290 | 400 | 301 | 162 | 122 | 258.67 |
| 1976 | 95 | 84.5 | 73 | 88 | 594 | 303 | 170 | 129 | 124 | 131 | 99 | 75.5 | 163.83 |
| 1977 | 67 | 61 | 56 | 88.5 | 670 | 265 | 186 | 134 | 243 | 259 | 163 | 123 | 192.96 |
| 1978 | 81.5 | 74 | 70 | 69 | 564 | 685 | 216 | 165 | 194 | 215 | 168 | 113 | 217.88 |
| 1979 | 94.5 | 74.5 | 69 | 70 | 603 | 988 | 274 | 140 | 113 | 97 | 96.5 | 83.5 | 225.25 |
| 1980 | 76.5 | 67 | 63 | 73 | 509 | 866 | 289 | 444 | 239 | 145 | 91 | 89.5 | 246 |
| 1981 | 80.5 | 70.5 | 66 | 108 | 691 | 498 | 182 | 177 | 116 | 103 | 81 | 70 | 186.92 |
| 1982 | 58 | 56.5 | 54 | 100 | 288 | 275 | 135 | 103 | 106 | 109 | 93.5 | 74.5 | 121.04 |
| 1983 | 66 | 62.5 | 57.5 | 61 | 159 | 1010 | 480 | 153 | 138 | 176 | 107 | 104 | 214.5 |
| 1984 | 91.5 | 77 | 71.5 | 65.5 | 465 | 860 | 407 | 261 | 195 | 168 | 104 | 76 | 236.79 |
| |
|
|
|
|
|
|
|
|
|
|
|
|
|
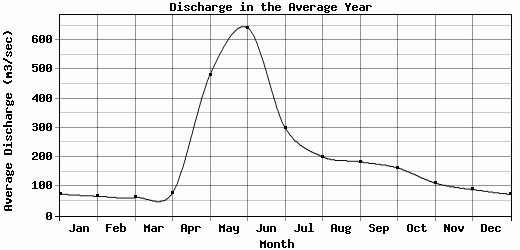
| Avg | 73.6 | 66.13 | 61.8 | 77.4 | 480.55 | 641.65 | 300.95 | 201.45 | 183.95 | 163.25 | 111.78 | 89.17 | 204.31 |
| |
|
|
|
|
|
|
|
|
|
|
|
|
|
| Std Dev | 11.83 |
8.92 |
7.51 |
16.18 |
165.76 |
286.96 |
130.98 |
92.24 |
76.45 |
61.7 |
30.81 |
18.01 |
39.41 |
| |
|
|
|
|
|
|
|
|
|
|
|
|
|
| | Jan | Feb | Mar | Apr | May | Jun | Jul | Aug | Sep | Oct | Nov | Dec | Avg Annual |
Click here for this table in tab-delimited format.
Tab-delimited format will open in most table browsing software, i.e. Excel, etc.
View this station on the map.
Return to start.