Results
| Country: | Yugoslavia
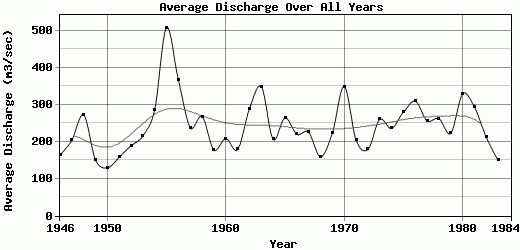
| | Station: | LjubicevskiMost | | River: | VelikaMorava | | Area: | 34345 km2 | | Lat: | 44.39 | | Lon: | 21.12 | | Source: | RivDIS | | PointID: | 769 | | Area Units: | km2 | | Discharge Units: | m3/sec | | Starting Year: | 1946 | | Ending Year: | 1984 | | Total Years: | 39 | | Total Usable Years: | 38 | |
| |
| Year | Jan | Feb | Mar | Apr | May | Jun | Jul | Aug | Sep | Oct | Nov | Dec | Avg Annual |
|---|
| 1946 | 161 | 294 | 487 | 235 | 207 | 134 | 51 | 33 | 32 | 40 | 122 | 177 | 164.42 |
| 1947 | 208 | 724 | 462 | 162 | 175 | 185 | 115 | 61 | 59 | 46 | 61 | 182 | 203.33 |
| 1948 | 596 | 239 | 261 | 580 | 300 | 760 | 215 | 74.8 | 70.4 | 56.5 | 60 | 59 | 272.64 |
| 1949 | 66.8 | 81 | 264 | 405 | 186 | 199 | 182 | 73.2 | 57 | 46.8 | 89.5 | 160 | 150.86 |
| 1950 | 184 | 346 | 281 | 231 | 116 | 78.2 | 38.7 | 29.6 | 26.3 | 28.6 | 93 | 106 | 129.87 |
| 1951 | 89.8 | 141 | 308 | 514 | 236 | 175 | 77 | 67.2 | 50.7 | 78.8 | 85 | 71.5 | 157.83 |
| 1952 | 130 | 290 | 299 | 354 | 126 | 101 | 44.8 | 30 | 28.6 | 62.5 | 156 | 645 | 188.91 |
| 1953 | 410 | 645 | 282 | 266 | 196 | 319 | 195 | 63 | 62.7 | 63.5 | 52.7 | 35.6 | 215.87 |
| 1954 | 53 | 85.6 | 691 | 458 | 635 | 298 | 110 | 57.7 | 49.7 | 115 | 426 | 462 | 286.75 |
| 1955 | 622 | 732 | 600 | 828 | 288 | 157 | 267 | 436 | 284 | 507 | 600 | 773 | 507.83 |
| 1956 | 487 | 466 | 858 | 854 | 630 | 390 | 233 | 90.5 | 61.7 | 67.1 | 102 | 158 | 366.44 |
| 1957 | 123 | 266 | 222 | 180 | 516 | 440 | 151 | 135 | 166 | 264 | 156 | 238 | 238.08 |
| 1958 | 331 | 206 | 604 | 803 | 639 | 158 | 86.1 | 55.7 | 58 | 69.3 | 101 | 106 | 268.09 |
| 1959 | 190 | 130 | 185 | 130 | 156 | 262 | 258 | 153 | 140 | 85.7 | 286 | 159 | 177.89 |
| 1960 | 191 | 548 | 299 | 266 | 326 | 255 | 139 | 81.3 | 56.7 | 66 | 116 | 154 | 208.17 |
| 1961 | 144 | 166 | 218 | 191 | 793 | 270 | 104 | 47.7 | 37.7 | 35.8 | 62.8 | 75.9 | 178.83 |
| 1962 | 139 | 285 | 902 | 1056 | 397 | 157 | 108 | 53.6 | 36.6 | 53.4 | 100 | 175 | 288.55 |
| 1963 | 715 | 1230 | 547 | 563 | 249 | 239 | 239 | 59.6 | 56.2 | 64.1 | 65.7 | 155 | 348.55 |
| 1964 | 115 | 192 | 334 | 318 | 346 | 204 | 149 | 77.5 | 86.8 | 140 | 290 | 227 | 206.61 |
| 1965 | 225 | 292 | 639 | 390 | 853 | 300 | 134 | 59 | 57 | 50 | 61 | 112 | 264.33 |
| 1966 | 240 | 620 | 305 | 334 | 320 | 313 | 93 | 69 | 56 | 46 | 74 | 175 | 220.42 |
| 1967 | 221 | 260 | 382 | 607 | 422 | 266 | 167 | 105 | 65 | 55 | 58 | 96 | 225.33 |
| 1968 | 242 | 383 | 312 | 202 | 99 | 97 | 50 | 74 | 81 | 70 | 117 | 182 | 159.08 |
| 1969 | 172 | 513 | 553 | 400 | 214 | 276 | 190 | 81 | 66 | 52 | 52 | 108 | 223.08 |
| 1970 | 359 | 597 | 536 | 600 | 668 | 504 | 349 | 117 | 86.2 | 97.7 | 142 | 132 | 348.99 |
| 1971 | 208 | 244 | 463 | 599 | 198 | 168 | 85.8 | 76.4 | 93.6 | 98.8 | 97.6 | 124 | 204.68 |
| 1972 | 132 | 153 | 125 | 114 | 139 | 75.7 | 94.2 | 75.7 | 189 | 553 | 275 | 220 | 178.8 |
| 1973 | 147 | 239 | 472 | 846 | 418 | 212 | 138 | 80.7 | 100 | 97.2 | 118 | 255 | 260.24 |
| 1974 | 291 | 274 | 232 | 257 | 486 | 292 | 191 | 80.5 | 62.8 | 112 | 211 | 340 | 235.78 |
| 1975 | 271 | 181 | 355 | 320 | 468 | 516 | 294 | 189 | 168 | 163 | 187 | 241 | 279.42 |
| 1976 | 197 | 251 | 355 | 453 | 279 | 503 | 225 | 272 | 187 | 147 | 334 | 512 | 309.58 |
| 1977 | 325 | 716 | 543 | 416 | 249 | 193 | 168 | 93 | 72 | 78 | 89 | 138 | 256.67 |
| 1978 | 217 | 408 | 552 | 453 | 398 | 317 | 174 | 76 | 138 | 128 | 86 | 202 | 262.42 |
| 1979 | 359 | 470 | 179 | 219 | 238 | 187 | 144 | 114 | 110 | 88 | 325 | 240 | 222.75 |
| 1980 | 411 | 537 | 414 | 370 | 787 | 460 | 176 | 127 | 98 | 106 | 161 | 299 | 328.83 |
| 1981 | 242 | 366 | 809 | 362 | 292 | 204 | 126 | 97 | 111 | 132 | 251 | 531 | 293.58 |
| 1982 | 356 | 233 | 456 | 468 | 399 | 149 | 98 | 87 | 67 | 73 | 67 | 87 | 211.67 |
| 1983 | 100 | 198 | 170 | 166 | 76 | 230 | 271 | 113 | 85 | 90 | 83 | 210 | 149.33 |
| 1984 | 280 | 437 | 806 | 739 | 477 | 158 | 97 | 75 | 72 | -9999 | -9999 | -9999 | -9999 |
| |
|
|
|
|
|
|
|
|
|
|
|
|
|
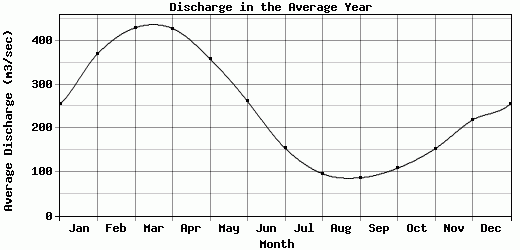
| Avg | 255.14 | 370.22 | 429.79 | 428.44 | 358.9 | 261.59 | 154.55 | 95.92 | 86.79 | 108.6 | 152.98 | 219.03 | 241.96 |
| |
|
|
|
|
|
|
|
|
|
|
|
|
|
| Std Dev | 150.48 |
228.65 |
199.39 |
228.54 |
202.86 |
140.62 |
73.18 |
70.36 |
52.34 |
108.52 |
117.92 |
161.3 |
73.47 |
| |
|
|
|
|
|
|
|
|
|
|
|
|
|
| | Jan | Feb | Mar | Apr | May | Jun | Jul | Aug | Sep | Oct | Nov | Dec | Avg Annual |
Click here for this table in tab-delimited format.
Tab-delimited format will open in most table browsing software, i.e. Excel, etc.
View this station on the map.
Return to start.