Results
| Country: | U.S.S.R.
| | Station: | Chutanovka | | River: | Vorona | | Area: | 5560 km2 | | Lat: | 52.61 | | Lon: | 42.71 | | Source: | RivDIS | | PointID: | 224 | | Area Units: | km2 | | Discharge Units: | m3/sec | | Starting Year: | 1965 | | Ending Year: | 1984 | | Total Years: | 20 | | Total Usable Years: | 20 | |
| |
| Year | Jan | Feb | Mar | Apr | May | Jun | Jul | Aug | Sep | Oct | Nov | Dec | Avg Annual |
|---|
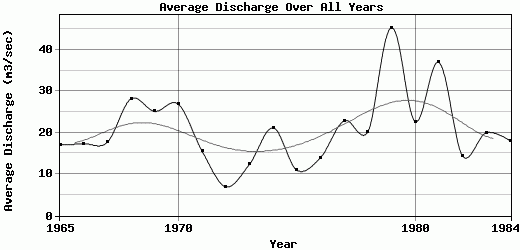
| 1965 | 6 | 4 | 17 | 102 | 22 | 7 | 4 | 3 | 3 | 5 | 8 | 23 | 17 |
| 1966 | 10 | 11 | 63 | 78 | 10 | 6 | 4 | 3 | 4 | 6 | 8 | 5 | 17.33 |
| 1967 | 4 | 5 | 10 | 140 | 15 | 5 | 4 | 4 | 4 | 6 | 8 | 7 | 17.67 |
| 1968 | 7 | 7 | 17 | 251 | 16 | 6 | 5 | 5 | 4 | 6 | 7 | 7 | 28.17 |
| 1969 | 4.8 | 4 | 3.6 | 99.5 | 10.5 | 8.2 | 8.8 | 5.1 | 3.7 | 7.4 | 133 | 13 | 25.13 |
| 1970 | 6.3 | 6.4 | 7.4 | 239 | 17.5 | 6.6 | 5.4 | 4.6 | 5.4 | 7.1 | 10.5 | 6.4 | 26.88 |
| 1971 | 6.6 | 5.4 | 39.5 | 93.5 | 12.5 | 2.8 | 3.6 | 1.7 | 2.3 | 4.3 | 7.2 | 7.6 | 15.58 |
| 1972 | 4.2 | 9.2 | 17.5 | 25.5 | 4.9 | 2.1 | 1.6 | 1.3 | 1.1 | 2.5 | 6.4 | 7.2 | 6.96 |
| 1973 | 4 | 4 | 6.2 | 89.5 | 3.8 | 2.3 | 3.9 | 4 | 4.9 | 6.3 | 12.5 | 6.7 | 12.34 |
| 1974 | 5.9 | 5.1 | 34.5 | 141 | 15.5 | 10 | 9.5 | 7.1 | 5.1 | 5.2 | 8.1 | 7 | 21.17 |
| 1975 | 6.5 | 5.8 | 13 | 76.5 | 5 | 3.5 | 1.6 | 4.1 | 3.4 | 4.4 | 4.3 | 3.7 | 10.98 |
| 1976 | 4.5 | 4.2 | 6.4 | 66.5 | 17 | 5.9 | 11.5 | 12 | 8.2 | 9.6 | 9.1 | 12.6 | 13.96 |
| 1977 | 9.5 | 7.7 | 55.5 | 125 | 15.5 | 7.2 | 9.7 | 6.3 | 6.3 | 8.3 | 12.5 | 11 | 22.88 |
| 1978 | 8.6 | 7.9 | 49.5 | 68.5 | 18 | 14 | 17 | 11.5 | 9.4 | 13.5 | 15.5 | 9.1 | 20.21 |
| 1979 | 7.7 | 8.9 | 12 | 363 | 73 | 9.1 | 9.4 | 8.5 | 11 | 12 | 12.5 | 16 | 45.26 |
| 1980 | 7.2 | 6.1 | 6.2 | 136 | 25 | 13 | 12 | 10 | 11 | 11 | 15.5 | 19 | 22.67 |
| 1981 | 16 | 17 | 52 | 255 | 27.5 | 10.5 | 8.6 | 8.2 | 9.6 | 11 | 13 | 15 | 36.95 |
| 1982 | 9.1 | 6.7 | 21.5 | 59.5 | 16 | 11 | 11.5 | 6.6 | 5.9 | 6.1 | 7.7 | 11 | 14.38 |
| 1983 | 9.1 | 8.4 | 77 | 86 | 18.5 | 5.5 | 6.4 | 4.9 | 4.4 | 5.5 | 6 | 8.3 | 20 |
| 1984 | 7.9 | 6.7 | 7.7 | 146 | 7.6 | 4.8 | 5.4 | 5.9 | 6.3 | 6.9 | 5.9 | 6.1 | 18.1 |
| |
|
|
|
|
|
|
|
|
|
|
|
|
|
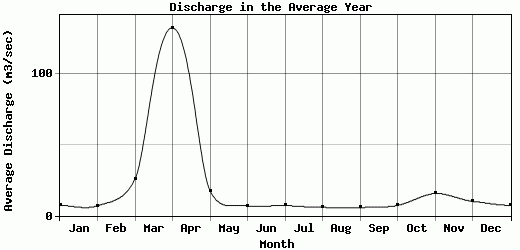
| Avg | 7.25 | 7.03 | 25.83 | 132.05 | 17.54 | 7.03 | 7.15 | 5.84 | 5.65 | 7.21 | 15.54 | 10.09 | 20.68 |
| |
|
|
|
|
|
|
|
|
|
|
|
|
|
| Std Dev | 2.72 |
2.96 |
21.85 |
81.48 |
14.16 |
3.31 |
3.91 |
2.91 |
2.76 |
2.79 |
27.13 |
4.88 |
8.65 |
| |
|
|
|
|
|
|
|
|
|
|
|
|
|
| | Jan | Feb | Mar | Apr | May | Jun | Jul | Aug | Sep | Oct | Nov | Dec | Avg Annual |
Click here for this table in tab-delimited format.
Tab-delimited format will open in most table browsing software, i.e. Excel, etc.
View this station on the map.
Return to start.