Results
| Country: | Germany
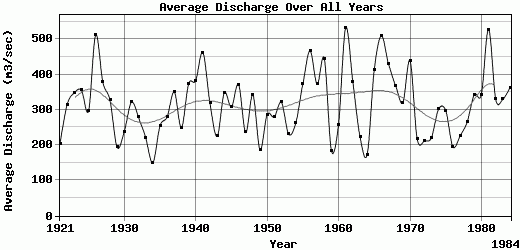
| | Station: | Intschede | | River: | Weser | | Area: | 37790 km2 | | Lat: | 52.96 | | Lon: | 9.13 | | Source: | RivDIS | | PointID: | 747 | | Area Units: | km2 | | Discharge Units: | m3/sec | | Starting Year: | 1921 | | Ending Year: | 1984 | | Total Years: | 64 | | Total Usable Years: | 64 | |
| |
| Year | Jan | Feb | Mar | Apr | May | Jun | Jul | Aug | Sep | Oct | Nov | Dec | Avg Annual |
|---|
| 1921 | 559 | 450 | 223 | 153 | 127 | 123 | 89 | 73 | 73 | 65 | 397 | 109 | 203.42 |
| 1922 | 387 | 347 | 500 | 335 | 354 | 141 | 127 | 136 | 144 | 207 | 370 | 730 | 314.83 |
| 1923 | 505 | 620 | 516 | 228 | 285 | 379 | 223 | 160 | 143 | 449 | 349 | 320 | 348.08 |
| 1924 | 414 | 422 | 372 | 449 | 414 | 234 | 166 | 302 | 553 | 314 | 390 | 233 | 355.25 |
| 1925 | 438 | 479 | 389 | 399 | 239 | 152 | 126 | 135 | 205 | 233 | 262 | 501 | 296.5 |
| 1926 | 1155 | 825 | 809 | 312 | 272 | 299 | 427 | 282 | 206 | 345 | 786 | 427 | 512.08 |
| 1927 | 635 | 390 | 411 | 622 | 338 | 283 | 320 | 333 | 341 | 245 | 306 | 319 | 378.58 |
| 1928 | 582 | 634 | 309 | 438 | 301 | 209 | 150 | 150 | 134 | 171 | 336 | 506 | 326.67 |
| 1929 | 298 | 171 | 384 | 364 | 182 | 140 | 117 | 100 | 89 | 114 | 121 | 250 | 194.17 |
| 1930 | 325 | 184 | 182 | 234 | 229 | 142 | 106 | 148 | 127 | 227 | 539 | 414 | 238.08 |
| 1931 | 631 | 468 | 415 | 308 | 329 | 222 | 252 | 246 | 288 | 206 | 225 | 267 | 321.42 |
| 1932 | 717 | 266 | 210 | 443 | 301 | 211 | 140 | 121 | 137 | 212 | 335 | 246 | 278.25 |
| 1933 | 260 | 377 | 306 | 195 | 138 | 228 | 327 | 151 | 132 | 128 | 174 | 231 | 220.58 |
| 1934 | 236 | 240 | 287 | 178 | 130 | 101 | 87.7 | 88.7 | 68.5 | 87.7 | 140 | 153 | 149.8 |
| 1935 | 228 | 562 | 336 | 517 | 277 | 193 | 143 | 119 | 123 | 144 | 194 | 213 | 254.08 |
| 1936 | 329 | 427 | 360 | 407 | 319 | 179 | 149 | 160 | 162 | 192 | 293 | 384 | 280.08 |
| 1937 | 450 | 854 | 797 | 500 | 387 | 238 | 201 | 167 | 150 | 141 | 135 | 181 | 350.08 |
| 1938 | 502 | 534 | 306 | 239 | 198 | 177 | 132 | 111 | 147 | 156 | 224 | 264 | 249.17 |
| 1939 | 738 | 398 | 468 | 440 | 328 | 165 | 141 | 183 | 136 | 239 | 435 | 802 | 372.75 |
| 1940 | 219 | 306 | 975 | 701 | 286 | 180 | 170 | 195 | 237 | 249 | 661 | 417 | 383 |
| 1941 | 526 | 835 | 673 | 470 | 251 | 322 | 177 | 251 | 274 | 498 | 647 | 628 | 462.67 |
| 1942 | 446 | 274 | 646 | 518 | 224 | 213 | 233 | 221 | 157 | 230 | 313 | 342 | 318.08 |
| 1943 | 337 | 502 | 258 | 313 | 234 | 191 | 132 | 119 | 141 | 113 | 130 | 225 | 224.58 |
| 1944 | 555 | 481 | 466 | 478 | 235 | 201 | 201 | 186 | 126 | 138 | 425 | 684 | 348 |
| 1945 | 259 | 911 | 494 | 319 | 245 | 179 | 161 | 278 | 181 | 152 | 206 | 310 | 307.92 |
| 1946 | 339 | 1439 | 739 | 339 | 237 | 262 | 195 | 161 | 165 | 188 | 201 | 198 | 371.92 |
| 1947 | 201 | 144 | 780 | 486 | 198 | 146 | 124 | 97.5 | 76.7 | 83.6 | 149 | 343 | 235.73 |
| 1948 | 1134 | 854 | 380 | 305 | 190 | 150 | 294 | 212 | 172 | 136 | 152 | 132 | 342.58 |
| 1949 | 171 | 191 | 378 | 299 | 189 | 210 | 129 | 109 | 106 | 78.9 | 90.4 | 293 | 187.03 |
| 1950 | 321 | 487 | 435 | 351 | 342 | 226 | 168 | 144 | 137 | 151 | 311 | 362 | 286.25 |
| 1951 | 535 | 413 | 437 | 424 | 238 | 229 | 194 | 149 | 134 | 115 | 183 | 308 | 279.92 |
| 1952 | 482 | 409 | 517 | 503 | 226 | 167 | 121 | 119 | 128 | 208 | 480 | 496 | 321.33 |
| 1953 | 389 | 631 | 414 | 264 | 178 | 168 | 159 | 130 | 128 | 108 | 105 | 100 | 231.17 |
| 1954 | 203 | 116 | 217 | 231 | 132 | 111 | 208 | 299 | 251 | 447 | 368 | 554 | 261.42 |
| 1955 | 682 | 602 | 482 | 534 | 303 | 306 | 316 | 258 | 221 | 204 | 204 | 357 | 372.42 |
| 1956 | 516 | 292 | 756 | 444 | 255 | 338 | 893 | 466 | 310 | 355 | 413 | 572 | 467.5 |
| 1957 | 513 | 741 | 694 | 401 | 235 | 191 | 171 | 173 | 309 | 346 | 312 | 385 | 372.58 |
| 1958 | 785 | 680 | 667 | 434 | 457 | 397 | 453 | 347 | 245 | 285 | 265 | 332 | 445.58 |
| 1959 | 600 | 318 | 246 | 207 | 156 | 137 | 116 | 95.2 | 69.3 | 73.5 | 93.4 | 97.4 | 184.07 |
| 1960 | 187 | 187 | 207 | 123 | 151 | 153 | 110 | 182 | 211 | 319 | 451 | 819 | 258.33 |
| 1961 | 613 | 1000 | 470 | 720 | 647 | 720 | 317 | 324 | 262 | 224 | 333 | 758 | 532.33 |
| 1962 | 549 | 879 | 449 | 751 | 353 | 240 | 291 | 231 | 219 | 163 | 150 | 274 | 379.08 |
| 1963 | 149 | 141 | 524 | 276 | 211 | 166 | 145 | 158 | 151 | 184 | 347 | 236 | 224 |
| 1964 | 180 | 290 | 212 | 245 | 228 | 140 | 116 | 118 | 91.7 | 107 | 152 | 193 | 172.73 |
| 1965 | 420 | 341 | 406 | 522 | 596 | 308 | 383 | 313 | 235 | 189 | 207 | 1040 | 413.33 |
| 1966 | 647 | 886 | 532 | 764 | 391 | 270 | 545 | 335 | 247 | 243 | 340 | 919 | 509.92 |
| 1967 | 808 | 570 | 681 | 541 | 306 | 404 | 246 | 240 | 251 | 232 | 264 | 607 | 429.17 |
| 1968 | 881 | 545 | 614 | 371 | 305 | 215 | 181 | 152 | 261 | 417 | 263 | 204 | 367.42 |
| 1969 | 334 | 344 | 448 | 694 | 464 | 375 | 232 | 193 | 190 | 156 | 204 | 206 | 320 |
| 1970 | 195 | 636 | 847 | 867 | 553 | 258 | 236 | 234 | 224 | 307 | 543 | 369 | 439.08 |
| 1971 | 332 | 390 | 283 | 234 | 218 | 244 | 199 | 143 | 133 | 116 | 128 | 201 | 218.42 |
| 1972 | 160 | 123 | 131 | 275 | 193 | 251 | 286 | 296 | 223 | 164 | 231 | 203 | 211.33 |
| 1973 | 160 | 285 | 339 | 346 | 277 | 166 | 133 | 117 | 105 | 150 | 186 | 387 | 220.92 |
| 1974 | 425 | 431 | 303 | 194 | 165 | 158 | 182 | 151 | 133 | 234 | 342 | 900 | 301.5 |
| 1975 | 737 | 393 | 349 | 553 | 389 | 235 | 188 | 147 | 145 | 136 | 141 | 162 | 297.92 |
| 1976 | 607 | 361 | 265 | 212 | 154 | 148 | 108 | 87.5 | 83.5 | 87 | 95.5 | 137 | 195.46 |
| 1977 | 170 | 360 | 260 | 305 | 198 | 182 | 139 | 175 | 140 | 134 | 337 | 303 | 225.25 |
| 1978 | 384 | 279 | 436 | 350 | 283 | 207 | 214 | 151 | 204 | 238 | 165 | 270 | 265.08 |
| 1979 | 338 | 281 | 892 | 588 | 422 | 261 | 188 | 216 | 174 | 144 | 201 | 411 | 343 |
| 1980 | 280 | 708 | 296 | 412 | 276 | 251 | 512 | 262 | 251 | 198 | 259 | 417 | 343.5 |
| 1981 | 627 | 622 | 1050 | 452 | 331 | 539 | 387 | 391 | 272 | 379 | 484 | 798 | 527.67 |
| 1982 | 800 | 630 | 555 | 367 | 341 | 214 | 173 | 155 | 133 | 159 | 164 | 268 | 329.92 |
| 1983 | 439 | 492 | 455 | 804 | 486 | 318 | 185 | 145 | 136 | 132 | 130 | 231 | 329.42 |
| 1984 | 446 | 620 | 272 | 313 | 328 | 549 | 253 | 194 | 282 | 355 | 359 | 384 | 362.92 |
| |
|
|
|
|
|
|
|
|
|
|
|
|
|
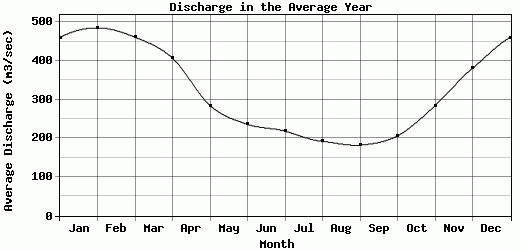
| Avg | 460.47 | 485.44 | 461.09 | 407.2 | 284.77 | 236.13 | 218.56 | 191.97 | 182.56 | 206.28 | 284.32 | 380.98 | 316.65 |
| |
|
|
|
|
|
|
|
|
|
|
|
|
|
| Std Dev | 224.7 |
248.42 |
205.33 |
167.53 |
109.84 |
108.28 |
130.94 |
82.02 |
81.04 |
98.95 |
147.34 |
219.64 |
91.39 |
| |
|
|
|
|
|
|
|
|
|
|
|
|
|
| | Jan | Feb | Mar | Apr | May | Jun | Jul | Aug | Sep | Oct | Nov | Dec | Avg Annual |
Click here for this table in tab-delimited format.
Tab-delimited format will open in most table browsing software, i.e. Excel, etc.
View this station on the map.
Return to start.