Results
| Country: | U.S.A.
| | Station: | MUSCODA, WI | | River: | WISCONSIN RIVER | | Area: | 18310227.63 | | Lat: | 43.19 | | Lon: | -90.44 | | Source: | USGS | | PointID: | 5407000 | | Area Units: | km2 | | Discharge Units: | m3/sec | | Starting Year: | 1968 | | Ending Year: | 1993 | | Total Years: | 26 | | Total Usable Years: | 25 | |
| |
| Year | Jan | Feb | Mar | Apr | May | Jun | Jul | Aug | Sep | Oct | Nov | Dec | Avg Annual |
|---|
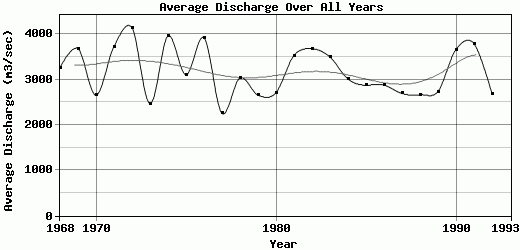
| 1968 | 2065.68 | 1896.56 | 2993.84 | 2803.01 | 3468.74 | 7252.93 | 6123.78 | 3258.37 | 2531.82 | 2102.49 | 2154.73 | 2489.06 | 3261.75 |
| 1969 | 2914.73 | 3296.5 | 3040.24 | 5239.59 | 6190.46 | 6137.24 | 5212.16 | 2904.32 | 2153.7 | 2136.11 | 2416.48 | 2552.27 | 3682.82 |
| 1970 | 2363.28 | 2042.46 | 2288.29 | 2455.37 | 3584.75 | 4873.36 | 3312.36 | 2761.73 | 2020.8 | 2107.52 | 1982 | 2091.53 | 2656.95 |
| 1971 | 1974.7 | 2589.39 | 3773.47 | 3422.96 | 7380.69 | 7821.16 | 5270.62 | 3567.49 | 1976.43 | 1948.03 | 2204.1 | 2800.09 | 3727.43 |
| 1972 | 2638.5 | 2823.01 | 4020.01 | 4227.44 | 6168.54 | 9924.17 | 6138.4 | 4118.75 | 2580.81 | 2065.04 | 2176.07 | 2801.65 | 4140.2 |
| 1973 | 2529.9 | 2648.75 | 2798.45 | 2793.94 | 2088.06 | 2389.95 | 2999.14 | 2890.44 | 2066.1 | 2060.29 | 1766.7 | 2612.47 | 2470.35 |
| 1974 | 4029.97 | 4157.54 | 3203.93 | 4061.6 | 5288.88 | 6646 | 5461.53 | 3771.82 | 2956.58 | 2566.07 | 2659.44 | 2699.43 | 3958.57 |
| 1975 | 2855.54 | 3359.41 | 3940.63 | 3451.09 | 4401.01 | 4161.66 | 3068.65 | 2633.94 | 1892.05 | 2112.91 | 2632.73 | 2730.49 | 3103.34 |
| 1976 | 3299.3 | 4128.23 | 4070.34 | 3835.92 | 5209.42 | 4594.91 | 5050.47 | 5219.46 | 3504.04 | 2883.04 | 2586.66 | 2628.64 | 3917.54 |
| 1977 | 3139.99 | 2653.71 | 2580.59 | 1762.92 | 2574.93 | 1983.13 | 1880.07 | 2124.32 | 2179.56 | 1825.35 | 2245.73 | 2116.47 | 2255.56 |
| 1978 | 2821.29 | 2853.75 | 2574.38 | 3773.9 | 4043.85 | 3174.34 | 3327.52 | 2590.64 | 2983.48 | 2693.86 | 2848.5 | 2719.53 | 3033.75 |
| 1979 | 3378.4 | 3041.75 | 2524.23 | 2695.5 | 3269.33 | 2646.7 | 2458.83 | 2414.07 | 2042.13 | 2155.75 | 2735.33 | 2519.57 | 2656.8 |
| 1980 | 2951.27 | 2627.72 | 2206.17 | 1977 | 3442.89 | 4467.48 | 3003.25 | 2480.11 | 1888.27 | 1959.54 | 2347.67 | 3136.7 | 2707.34 |
| 1981 | 4120.58 | 3570.37 | 2864.58 | 2678.32 | 3901.35 | 6363.77 | 5127.2 | 3905.92 | 2326.62 | 2355.33 | 2371.93 | 2772.33 | 3529.86 |
| 1982 | 3268.15 | 3372.25 | 5259.65 | 4250.38 | 4657.69 | 5078.18 | 4896.1 | 3496.51 | 2345.21 | 2196.39 | 2818.96 | 2521.22 | 3680.06 |
| 1983 | 3133.5 | 4077.55 | 5366.53 | 4255.1 | 4292.31 | 3631.84 | 3846.18 | 3578.17 | 2203.06 | 1943.09 | 2373.63 | 3249.79 | 3495.9 |
| 1984 | 3024.53 | 3807.27 | 3013.93 | 3720.67 | 3741.95 | 3675.74 | 3234.9 | 2870.16 | 1957.08 | 2186.44 | 2130.76 | 2781.28 | 3012.06 |
| 1985 | 4085.32 | 3969.44 | 3075.13 | 2515.12 | 3517.34 | 2742.69 | 2073.26 | 1775.48 | 1775.29 | 2386.85 | 3111.75 | 3496.51 | 2877.01 |
| 1986 | 2203.15 | 2667.36 | 3318.48 | 3972.5 | 3605.67 | 3497.15 | 3245.77 | 2633.21 | 1999.18 | 2106.33 | 2493.88 | 2777.44 | 2876.68 |
| 1987 | 3395.76 | 2635.81 | 2131.17 | 2488.88 | 3928.02 | 3123.65 | 2296.97 | 2353.78 | 2202.97 | 2583.61 | 2266.21 | 2920.03 | 2693.91 |
| 1988 | 3185.75 | 2788.44 | 2457.92 | 2045.15 | 3045.36 | 2830.28 | 2206.81 | 2256.86 | 2454.8 | 2325.28 | 2796.4 | 3567.3 | 2663.36 |
| 1989 | 3533.96 | 3075.53 | 2117.66 | 2468.02 | 4283.91 | 2982.91 | 2017.91 | 1944.92 | 2037.12 | 2366.21 | 2906.08 | 3099.43 | 2736.14 |
| 1990 | 3526.93 | 3964.18 | 4099.21 | 3975.99 | 4082.22 | 5911.65 | 4107.61 | 3139.26 | 1970.11 | 2044.94 | 3101.37 | 4035.54 | 3663.25 |
| 1991 | 4177.31 | 3876.4 | 4630.29 | 4810.11 | 5029.46 | 4973.41 | 4153.46 | 3755.66 | 2305.57 | 2504.68 | 2651.13 | 2659.24 | 3793.89 |
| 1992 | 3027.09 | 2333.32 | 2772.05 | 2459.14 | 3567.3 | 3983.92 | 2476.46 | 2389.32 | 2013.9 | 1836.22 | 2301.7 | 3098.88 | 2688.28 |
| 1993 | -9999 | -9999 | -9999 | -9999 | -9999 | -9999 | -9999 | -9999 | -9999 | -9999 | -9999 | -9999 | -9999 |
| |
|
|
|
|
|
|
|
|
|
|
|
|
|
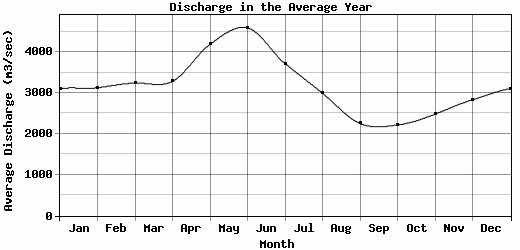
| Avg | 3105.78 | 3130.27 | 3244.85 | 3285.58 | 4190.57 | 4594.73 | 3719.58 | 2993.39 | 2254.67 | 2218.05 | 2483.2 | 2835.08 | 3171.31 |
| |
|
|
|
|
|
|
|
|
|
|
|
|
|
| Std Dev | 602.55 |
657.19 |
906.68 |
922.13 |
1158.06 |
1898.81 |
1318.52 |
775.1 |
394.65 |
263.9 |
335.19 |
422.83 |
529.99 |
| |
|
|
|
|
|
|
|
|
|
|
|
|
|
| | Jan | Feb | Mar | Apr | May | Jun | Jul | Aug | Sep | Oct | Nov | Dec | Avg Annual |
Click here for this table in tab-delimited format.
Tab-delimited format will open in most table browsing software, i.e. Excel, etc.
View this station on the map.
Return to start.