Results
| Country: | U.S.A.
| | Station: | NECEDAH, WI | | River: | WISCONSIN RIVER | | Area: | 18310222.45 | | Lat: | 44.03 | | Lon: | -90.02 | | Source: | USGS | | PointID: | 5401500 | | Area Units: | km2 | | Discharge Units: | m3/sec | | Starting Year: | 1966 | | Ending Year: | 1993 | | Total Years: | 28 | | Total Usable Years: | 27 | |
| |
| Year | Jan | Feb | Mar | Apr | May | Jun | Jul | Aug | Sep | Oct | Nov | Dec | Avg Annual |
|---|
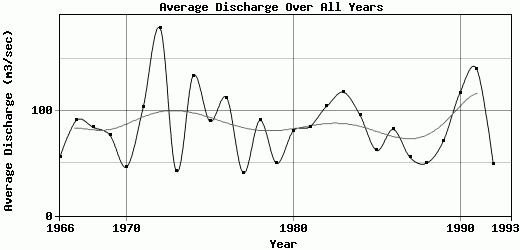
| 1966 | 32.92 | 29.8 | 24.86 | 66.07 | 162.65 | 151.83 | 72.41 | 23 | 19.65 | 25.86 | 29.67 | 37.42 | 56.34 |
| 1967 | 33.94 | 29.11 | 37.4 | 44.57 | 200.27 | 498.57 | 111.1 | 25.87 | 12.99 | 23.75 | 49.21 | 28.36 | 91.26 |
| 1968 | 44.75 | 63.48 | 60.24 | 40.51 | 207.75 | 316.86 | 108.05 | 34.81 | 30.47 | 35.13 | 41.47 | 28.55 | 84.34 |
| 1969 | 38.46 | 38.08 | 46.79 | 77.08 | 312.65 | 202.31 | 57.34 | 22.83 | 23.55 | 39.04 | 34.65 | 29.44 | 76.85 |
| 1970 | 24.84 | 22.67 | 23.92 | 27.62 | 131.88 | 210.09 | 36.85 | 12.92 | 14.54 | 20.61 | 17.07 | 16.01 | 46.59 |
| 1971 | 19.13 | 38.65 | 27.54 | 61.53 | 371.34 | 419.94 | 143.89 | 42.94 | 28.98 | 34.81 | 30.32 | 26.14 | 103.77 |
| 1972 | 35.97 | 42.08 | 87.2 | 123.75 | 465.01 | 829.4 | 311.14 | 107.21 | 53.23 | 38.69 | 35.44 | 25.84 | 179.58 |
| 1973 | 23.1 | 24.94 | 22 | 30.12 | 139.47 | 124.13 | 39.38 | 13.6 | 13.97 | 23.02 | 25.81 | 26.82 | 42.2 |
| 1974 | 29.24 | 43.26 | 74.8 | 135.56 | 314.63 | 571.44 | 245.28 | 80.6 | 28.07 | 31.33 | 28.78 | 25.42 | 134.03 |
| 1975 | 24.9 | 44.56 | 60.24 | 60.17 | 164.59 | 371.54 | 129 | 37.47 | 32.08 | 42.61 | 48.19 | 65.35 | 90.06 |
| 1976 | 49.55 | 61.99 | 52.82 | 61.77 | 301.73 | 308.61 | 216.94 | 103.55 | 63.21 | 39.38 | 50.18 | 44.73 | 112.87 |
| 1977 | 29.05 | 31.72 | 19.6 | 41.09 | 122.3 | 112.06 | 26.57 | 12.29 | 15.65 | 23.64 | 25.77 | 29.1 | 40.74 |
| 1978 | 27.11 | 40.69 | 46.99 | 83.91 | 234.41 | 310.25 | 103.94 | 33.87 | 54.66 | 46.38 | 64.6 | 46.79 | 91.13 |
| 1979 | 28.45 | 29.32 | 32.4 | 34.08 | 188.6 | 130.31 | 43.08 | 14.85 | 23.34 | 22.51 | 22.26 | 30.16 | 49.95 |
| 1980 | 22.49 | 31.55 | 27.47 | 67.18 | 304.05 | 231.74 | 82.95 | 30.65 | 32.16 | 32.73 | 37.87 | 72.03 | 81.07 |
| 1981 | 75.77 | 41.42 | 37.49 | 45.33 | 212.97 | 255.5 | 142.91 | 64.88 | 35.37 | 40.03 | 38.46 | 31.2 | 85.11 |
| 1982 | 29.92 | 44 | 56.71 | 60.97 | 215.78 | 370.74 | 191.96 | 87.15 | 65.73 | 48.53 | 41.1 | 40.49 | 104.42 |
| 1983 | 47.75 | 60.72 | 111.74 | 162.84 | 335.33 | 294.17 | 151.04 | 77.18 | 56.38 | 39.39 | 48.98 | 31.16 | 118.06 |
| 1984 | 84.1 | 66.49 | 72.93 | 89.53 | 148.31 | 347.69 | 148.26 | 58.63 | 39.3 | 35.29 | 36.7 | 25.43 | 96.06 |
| 1985 | 28.29 | 29.51 | 29.82 | 66.34 | 212.93 | 205.26 | 40.42 | 14.09 | 23.89 | 33.58 | 37.1 | 26.92 | 62.35 |
| 1986 | 23.3 | 31.23 | 78.02 | 91.62 | 205.27 | 290.99 | 82.87 | 49.39 | 29.35 | 31.72 | 39.62 | 35.44 | 82.4 |
| 1987 | 26.47 | 28.78 | 40.43 | 72.48 | 268.77 | 110.82 | 38.4 | 17.68 | 13.31 | 17.13 | 16.25 | 18.26 | 55.73 |
| 1988 | 15.29 | 17.51 | 17.01 | 60.51 | 189.67 | 158.45 | 50.52 | 14.8 | 10.55 | 18.27 | 28.53 | 21.07 | 50.18 |
| 1989 | 16.83 | 21.82 | 24.22 | 65.73 | 209.62 | 217.61 | 67.8 | 34.77 | 34.95 | 32.14 | 65.38 | 62 | 71.07 |
| 1990 | 36.69 | 31.19 | 31.8 | 120.04 | 206.08 | 422.02 | 188.49 | 85.81 | 43.56 | 42.33 | 134.41 | 67.96 | 117.53 |
| 1991 | 45.47 | 84.35 | 90.34 | 114.73 | 418.35 | 455.43 | 266.16 | 85.47 | 33.96 | 27.39 | 33.39 | 30.14 | 140.43 |
| 1992 | 27.73 | 34.39 | 52.36 | 87.32 | 146.2 | 74.32 | 54.03 | 22.22 | 20.65 | 25.26 | 26.07 | 17.47 | 49 |
| 1993 | -9999 | -9999 | -9999 | -9999 | -9999 | -9999 | -9999 | -9999 | -9999 | -9999 | -9999 | -9999 | -9999 |
| |
|
|
|
|
|
|
|
|
|
|
|
|
|
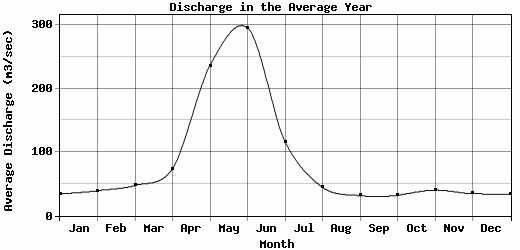
| Avg | 34.13 | 39.38 | 47.67 | 73.79 | 236.69 | 296 | 116.7 | 44.76 | 31.61 | 32.24 | 40.27 | 34.8 | 85.67 |
| |
|
|
|
|
|
|
|
|
|
|
|
|
|
| Std Dev | 15.67 |
15.45 |
24.44 |
33.01 |
87.29 |
163.65 |
76.47 |
30.03 |
15.48 |
8.5 |
22.01 |
15.18 |
33.2 |
| |
|
|
|
|
|
|
|
|
|
|
|
|
|
| | Jan | Feb | Mar | Apr | May | Jun | Jul | Aug | Sep | Oct | Nov | Dec | Avg Annual |
Click here for this table in tab-delimited format.
Tab-delimited format will open in most table browsing software, i.e. Excel, etc.
View this station on the map.
Return to start.