Results
| Country: | Poland
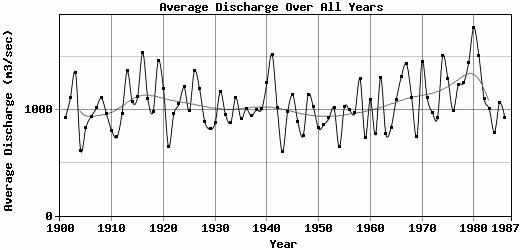
| | Station: | Tczew | | River: | Wisla | | Area: | 194376 km2 | | Lat: | 54.09 | | Lon: | 18.8 | | Source: | RivDIS | | PointID: | 764 | | Area Units: | km2 | | Discharge Units: | m3/sec | | Starting Year: | 1900 | | Ending Year: | 1987 | | Total Years: | 88 | | Total Usable Years: | 87 | |
| |
| Year | Jan | Feb | Mar | Apr | May | Jun | Jul | Aug | Sep | Oct | Nov | Dec | Avg Annual |
|---|
| 1900 | -9999 | -9999 | -9999 | -9999 | -9999 | -9999 | -9999 | -9999 | -9999 | -9999 | 718 | 969 | -9999 |
| 1901 | 412 | 625 | 1469 | 2213 | 955 | 972 | 1020 | 709 | 545 | 506 | 501 | 1143 | 922.5 |
| 1902 | 1664 | 1049 | 1317 | 1967 | 1165 | 964 | 1339 | 846 | 770 | 962 | 673 | 615 | 1110.92 |
| 1903 | 904 | 1795 | 2026 | 1077 | 1425 | 1144 | 2605 | 1715 | 800 | 709 | 882 | 1179 | 1355.08 |
| 1904 | 550 | 920 | 1107 | 957 | 752 | 411 | 318 | 260 | 381 | 427 | 680 | 636 | 616.58 |
| 1905 | 564 | 873 | 1635 | 1637 | 1006 | 710 | 550 | 441 | 508 | 550 | 807 | 709 | 832.5 |
| 1906 | 673 | 737 | 2004 | 1667 | 716 | 1204 | 1266 | 557 | 710 | 687 | 478 | 579 | 939.83 |
| 1907 | 745 | 769 | 1035 | 3074 | 1505 | 987 | 991 | 846 | 919 | 521 | 388 | 419 | 1016.58 |
| 1908 | 608 | 835 | 2714 | 2064 | 1556 | 755 | 752 | 1737 | 957 | 593 | 411 | 405 | 1115.58 |
| 1909 | 752 | 729 | 1295 | 2460 | 1852 | 807 | 919 | 499 | 388 | 492 | 553 | 803 | 962.42 |
| 1910 | 940 | 961 | 1216 | 710 | 810 | 359 | 557 | 1006 | 897 | 550 | 777 | 875 | 804.83 |
| 1911 | 897 | 641 | 2692 | 1593 | 398 | 643 | 398 | 318 | 299 | 340 | 314 | 354 | 740.58 |
| 1912 | 318 | 595 | 2156 | 1697 | 687 | 905 | 412 | 499 | 927 | 919 | 1234 | 1259 | 967.33 |
| 1913 | 854 | 825 | 1078 | 1278 | 1223 | 792 | 1737 | 2591 | 2094 | 1396 | 1039 | 1505 | 1367.67 |
| 1914 | 1049 | 1097 | 1954 | 2086 | 1114 | 740 | 854 | 694 | 441 | 1129 | 867 | 897 | 1076.83 |
| 1915 | 1107 | 1314 | 1628 | 2505 | 1078 | 508 | 405 | 723 | 860 | 868 | 815 | 1657 | 1122.33 |
| 1916 | 3068 | 1911 | 1867 | 2520 | 1715 | 800 | 1049 | 1035 | 890 | 1006 | 1353 | 1273 | 1540.58 |
| 1917 | 1389 | 665 | 1035 | 4390 | 1787 | 695 | 542 | 557 | 516 | 340 | 605 | 702 | 1101.92 |
| 1918 | 875 | 1738 | 1881 | 1129 | 608 | 456 | 521 | 1375 | 1039 | 687 | 875 | 579 | 980.25 |
| 1919 | 1273 | 568 | 1744 | 1712 | 3025 | 1518 | 1954 | 2091 | 882 | 680 | 673 | 1483 | 1466.92 |
| 1920 | 2381 | 1593 | 2634 | 1937 | 875 | 800 | 665 | 796 | 1323 | 644 | 471 | 340 | 1204.92 |
| 1921 | 1027 | 785 | 1556 | 987 | 984 | 463 | 484 | 267 | 254 | 267 | 344 | 369 | 648.92 |
| 1922 | 608 | 424 | 2374 | 1503 | 745 | 381 | 383 | 839 | 635 | 1425 | 1166 | 1064 | 962.25 |
| 1923 | 1527 | 1666 | 1657 | 1346 | 991 | 807 | 665 | 434 | 396 | 846 | 912 | 1425 | 1056 |
| 1924 | 550 | 657 | 1129 | 4210 | 1881 | 1234 | 810 | 984 | 1054 | 788 | 703 | 593 | 1216.08 |
| 1925 | 825 | 1025 | 1064 | 905 | 767 | 456 | 1693 | 1114 | 1465 | 854 | 972 | 745 | 990.42 |
| 1926 | 1447 | 1282 | 1845 | 1368 | 1237 | 1473 | 1512 | 1389 | 837 | 948 | 1996 | 1107 | 1370.08 |
| 1927 | 1187 | 777 | 2316 | 2505 | 1396 | 1234 | 991 | 977 | 1024 | 788 | 613 | 557 | 1197.08 |
| 1928 | 731 | 1578 | 1035 | 1914 | 1295 | 1219 | 506 | 369 | 388 | 521 | 523 | 600 | 889.92 |
| 1929 | 535 | 464 | 593 | 2400 | 1216 | 934 | 803 | 665 | 463 | 492 | 665 | 629 | 821.58 |
| 1930 | 477 | 424 | 1056 | 1234 | 897 | 568 | 340 | 760 | 770 | 890 | 1735 | 1396 | 878.92 |
| 1931 | 760 | 609 | 1433 | 2595 | 1302 | 598 | 448 | 535 | 1114 | 2004 | 1817 | 868 | 1173.58 |
| 1932 | 1324 | 618 | 658 | 2655 | 1273 | 830 | 665 | 810 | 613 | 636 | 807 | 615 | 958.67 |
| 1933 | 427 | 849 | 1237 | 1144 | 752 | 755 | 1013 | 644 | 912 | 933 | 1114 | 723 | 875.25 |
| 1934 | 492 | 649 | 1932 | 1278 | 629 | 538 | 1556 | 1512 | 1458 | 969 | 1054 | 1346 | 1117.75 |
| 1935 | 412 | 721 | 2055 | 1645 | 1027 | 949 | 629 | 680 | 725 | 665 | 852 | 644 | 917 |
| 1936 | 1194 | 951 | 1867 | 1047 | 687 | 747 | 622 | 680 | 710 | 1114 | 1495 | 1027 | 1011.75 |
| 1937 | 752 | 673 | 2533 | 2071 | 998 | 583 | 535 | 535 | 807 | 513 | 613 | 709 | 943.5 |
| 1938 | 912 | 1226 | 1548 | 1608 | 1244 | 852 | 796 | 644 | 1069 | 622 | 815 | 680 | 1001.33 |
| 1939 | 1078 | 1434 | 1346 | 1353 | 1035 | 1293 | 564 | 673 | 411 | 644 | 1249 | 1035 | 1009.58 |
| 1940 | 760 | 1145 | 1635 | 3298 | 1462 | 1368 | 839 | 803 | 934 | 752 | 1106 | 955 | 1254.75 |
| 1941 | 832 | 1009 | 2953 | 2655 | 2793 | 1368 | 854 | 926 | 1346 | 955 | 1346 | 1302 | 1528.25 |
| 1942 | 1187 | 961 | 1194 | 3141 | 1672 | 852 | 564 | 687 | 471 | 448 | 478 | 629 | 1023.67 |
| 1943 | 644 | 849 | 890 | 732 | 528 | 448 | 803 | 557 | 373 | 398 | 418 | 557 | 599.75 |
| 1944 | 723 | 1346 | 1447 | 1937 | 1129 | 942 | 709 | 875 | 403 | 521 | 822 | 912 | 980.5 |
| 1945 | 825 | 905 | 2077 | 1795 | 1404 | 830 | 955 | 1049 | 628 | 1389 | 919 | 933 | 1142.42 |
| 1946 | 962 | 1178 | 2026 | 1937 | 810 | 538 | 550 | 463 | 493 | 484 | 635 | 535 | 884.25 |
| 1947 | 304 | 264 | 1592 | 2662 | 767 | 441 | 419 | 347 | 501 | 369 | 478 | 883 | 752.25 |
| 1948 | 1606 | 1671 | 1396 | 1548 | 723 | 1398 | 1744 | 984 | 725 | 593 | 800 | 579 | 1147.25 |
| 1949 | 723 | 1065 | 1621 | 2086 | 940 | 635 | 940 | 1353 | 762 | 557 | 658 | 977 | 1026.42 |
| 1950 | 767 | 1378 | 1708 | 972 | 716 | 463 | 376 | 448 | 426 | 550 | 852 | 1259 | 826.25 |
| 1951 | 767 | 825 | 1643 | 2341 | 1556 | 830 | 528 | 398 | 321 | 340 | 336 | 427 | 859.33 |
| 1952 | 463 | 526 | 825 | 2146 | 940 | 680 | 477 | 318 | 396 | 796 | 2086 | 1404 | 921.42 |
| 1953 | 1114 | 2051 | 2793 | 1346 | 810 | 897 | 557 | 550 | 568 | 492 | 448 | 571 | 1016.42 |
| 1954 | 456 | 360 | 1136 | 1136 | 998 | 800 | 644 | 456 | 366 | 383 | 433 | 579 | 645.58 |
| 1955 | 839 | 1009 | 883 | 2183 | 1158 | 919 | 1288 | 1288 | 673 | 513 | 688 | 912 | 1029.42 |
| 1956 | 1013 | 680 | 1078 | 2475 | 1273 | 620 | 803 | 600 | 658 | 774 | 762 | 1237 | 997.75 |
| 1957 | 1143 | 1795 | 1606 | 1084 | 1027 | 620 | 542 | 716 | 718 | 904 | 718 | 774 | 970.58 |
| 1958 | 731 | 1602 | 1396 | 3530 | 1997 | 852 | 1244 | 738 | 650 | 955 | 1017 | 846 | 1296.5 |
| 1959 | 919 | 857 | 1606 | 949 | 738 | 650 | 723 | 781 | 433 | 361 | 418 | 405 | 736.67 |
| 1960 | 658 | 688 | 1266 | 1054 | 825 | 807 | 1179 | 2265 | 994 | 767 | 1166 | 1498 | 1097.25 |
| 1961 | 962 | 1186 | 1339 | 1189 | 731 | 658 | 463 | 716 | 493 | 398 | 508 | 586 | 769.08 |
| 1962 | 723 | 769 | 1288 | 2999 | 2012 | 2991 | 1208 | 839 | 658 | 723 | 680 | 738 | 1302.33 |
| 1963 | 550 | 480 | 1064 | 2041 | 1244 | 703 | 412 | 390 | 471 | 651 | 680 | 600 | 773.83 |
| 1964 | 564 | 502 | 441 | 3380 | 1165 | 598 | 477 | 398 | 411 | 463 | 583 | 991 | 831.08 |
| 1965 | 658 | 681 | 1657 | 1996 | 1270 | 1697 | 1049 | 1056 | 942 | 651 | 493 | 991 | 1095.08 |
| 1966 | 738 | 1787 | 2808 | 1593 | 1035 | 1114 | 1136 | 1266 | 905 | 636 | 1017 | 1795 | 1319.17 |
| 1967 | 904 | 1907 | 3517 | 2094 | 2012 | 1637 | 1926 | 680 | 598 | 622 | 658 | 673 | 1435.67 |
| 1968 | 1049 | 1671 | 1614 | 1735 | 1035 | 1106 | 680 | 969 | 852 | 984 | 927 | 774 | 1116.33 |
| 1969 | 636 | 649 | 767 | 1817 | 1143 | 777 | 825 | 477 | 538 | 398 | 426 | 477 | 744.17 |
| 1970 | 600 | 681 | 1085 | 3560 | 2055 | 1473 | 1483 | 1505 | 942 | 839 | 1488 | 1816 | 1460.58 |
| 1971 | 1136 | 2372 | 1852 | 1907 | 1143 | 905 | 926 | 528 | 478 | 579 | 628 | 890 | 1112 |
| 1972 | 680 | 595 | 861 | 919 | 1107 | 852 | 883 | 1056 | 1473 | 1158 | 1084 | 1027 | 974.58 |
| 1973 | 528 | 1057 | 1577 | 1413 | 984 | 942 | 1194 | 1006 | 508 | 557 | 725 | 658 | 929.08 |
| 1974 | 1107 | 1538 | 1035 | 628 | 658 | 1667 | 1534 | 1339 | 762 | 2178 | 3320 | 2374 | 1511.67 |
| 1975 | 2873 | 1554 | 1244 | 1682 | 1368 | 1226 | 1114 | 1288 | 792 | 752 | 837 | 788 | 1293.17 |
| 1976 | 1396 | 951 | 1295 | 2154 | 1129 | 1159 | 579 | 528 | 531 | 687 | 680 | 868 | 996.42 |
| 1977 | 673 | 1522 | 2641 | 1682 | 1288 | 949 | 803 | 1302 | 1189 | 1027 | 927 | 825 | 1235.67 |
| 1978 | 1035 | 801 | 2142 | 1682 | 1585 | 1106 | 1056 | 825 | 1174 | 1346 | 1204 | 1085 | 1253.42 |
| 1979 | 977 | 1234 | 3054 | 4106 | 1824 | 890 | 752 | 868 | 777 | 694 | 949 | 1230 | 1446.25 |
| 1980 | 765 | 1180 | 925 | 1810 | 1480 | 1440 | 2260 | 3150 | 1460 | 2550 | 2140 | 2200 | 1780 |
| 1981 | 1970 | 2050 | 2400 | 1820 | 1240 | 1110 | 1190 | 1100 | 1140 | 1020 | 1620 | 1480 | 1511.67 |
| 1982 | 1910 | 1100 | 2130 | 1740 | 1400 | 921 | 1020 | 640 | 530 | 562 | 609 | 739 | 1108.42 |
| 1983 | 1210 | 1290 | 1770 | 1900 | 1310 | 884 | 844 | 647 | 474 | 597 | 617 | 570 | 1009.42 |
| 1984 | 803 | 732 | 744 | 949 | 850 | 947 | 1050 | 657 | 511 | 852 | 639 | 707 | 786.75 |
| 1985 | 470 | 689 | 1216 | 1705 | 1353 | 1174 | 1064 | 1208 | 1054 | 788 | 762 | 1375 | 1071.5 |
| 1986 | 1317 | 1089 | 1396 | 1705 | 955 | 942 | 615 | 622 | 635 | 593 | 673 | 608 | 929.17 |
| 1987 | 586 | 1137 | 984 | 2064 | 1223 | 1436 | 731 | 615 | 575 | 709 | -9999 | -9999 | -9999 |
| |
|
|
|
|
|
|
|
|
|
|
|
|
|
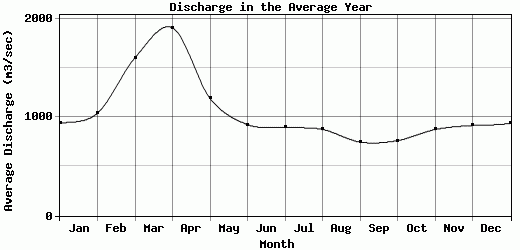
| Avg | 937.29 | 1039.31 | 1601.59 | 1904.8 | 1189.34 | 923.52 | 895.18 | 874.52 | 746.7 | 761.38 | 873.76 | 914.39 | 1056.03 |
| |
|
|
|
|
|
|
|
|
|
|
|
|
|
| Std Dev | 486.9 |
452.73 |
616.28 |
792.09 |
453.68 |
387.43 |
447.41 |
497.85 |
329.61 |
378.7 |
471.69 |
403.45 |
235.91 |
| |
|
|
|
|
|
|
|
|
|
|
|
|
|
| | Jan | Feb | Mar | Apr | May | Jun | Jul | Aug | Sep | Oct | Nov | Dec | Avg Annual |
Click here for this table in tab-delimited format.
Tab-delimited format will open in most table browsing software, i.e. Excel, etc.
View this station on the map.
Return to start.