Results
| Country: | U.S.S.R.
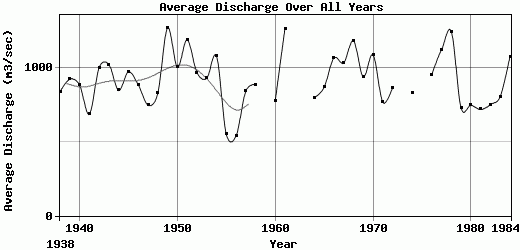
| | Station: | Dzhangky | | River: | Yana | | Area: | 216000 km2 | | Lat: | 69.67 | | Lon: | 135.33 | | Source: | RivDIS | | PointID: | 933 | | Area Units: | km2 | | Discharge Units: | m3/sec | | Starting Year: | 1938 | | Ending Year: | 1984 | | Total Years: | 47 | | Total Usable Years: | 46 | |
| |
| Year | Jan | Feb | Mar | Apr | May | Jun | Jul | Aug | Sep | Oct | Nov | Dec | Avg Annual |
|---|
| 1938 | 1.7 | 1.3 | 2.1 | 2.2 | 244 | 4110 | 3070 | 1580 | 737 | 205 | 95 | 46 | 841.19 |
| 1939 | 5 | 1.2 | 1.1 | 1 | 1180 | 3420 | 2700 | 2430 | 1090 | 230 | 47.5 | 12.5 | 926.53 |
| 1940 | 8.8 | 8.7 | 8.6 | 6.3 | 539 | 3340 | 2700 | 3030 | 884 | 87.5 | 20 | 8.9 | 886.82 |
| 1941 | 9.6 | 10.5 | 11.5 | 12.5 | 306 | 3400 | 1460 | 1570 | 1310 | 146 | 31 | 6.1 | 689.43 |
| 1942 | 5.2 | 4.5 | 4.3 | 3.8 | 243 | 3510 | 2830 | 4050 | 1250 | 123 | 18.5 | 3.5 | 1003.82 |
| 1943 | 2.2 | 1.7 | 1.3 | 0.8 | 1280 | 4750 | 3990 | 1460 | 651 | 137 | 31 | 4.3 | 1025.77 |
| 1944 | 1.8 | 1.6 | 1.3 | 0.7 | 911 | 4010 | 2740 | 1180 | 1160 | 164 | 35.5 | 8.5 | 851.2 |
| 1945 | 1.9 | 1.1 | 0.9 | 0.6 | 780 | 2210 | 5400 | 1480 | 1600 | 197 | 38.5 | 9.6 | 976.63 |
| 1946 | 1.9 | 0.9 | 1.6 | 2.7 | 249 | 3190 | 2420 | 3800 | 840 | 123 | 31 | 6.1 | 888.85 |
| 1947 | 2.1 | 1.5 | 1 | 0.6 | 118 | 4950 | 2430 | 626 | 624 | 206 | 46.5 | 12.5 | 751.52 |
| 1948 | 2.1 | 1.2 | 0.8 | 0.7 | 316 | 4800 | 2440 | 1290 | 947 | 121 | 39 | 9.9 | 830.64 |
| 1949 | 2.2 | 1.5 | 1 | 1 | 1110 | 4380 | 2400 | 5370 | 1770 | 222 | 39 | 9.2 | 1275.49 |
| 1950 | 1.4 | 1 | 0.9 | 1.3 | 6.8 | 4720 | 4320 | 1700 | 1190 | 109 | 38.5 | 10.5 | 1008.28 |
| 1951 | 1.6 | 0.7 | 0.2 | 0.2 | 340 | 5380 | 3830 | 3300 | 1290 | 143 | 38 | 10.5 | 1194.52 |
| 1952 | 2.6 | 0.6 | 0.3 | 0 | 38.5 | 2580 | 4130 | 2980 | 1720 | 178 | 30 | 6.2 | 972.18 |
| 1953 | 2.1 | 1.1 | 0.5 | 0 | 1780 | 3050 | 2350 | 1500 | 2240 | 214 | 53.5 | 11.5 | 933.56 |
| 1954 | 1.6 | 0.9 | 0.6 | 0.2 | 45 | 5800 | 3790 | 1710 | 1450 | 148 | 39.5 | 3.1 | 1082.41 |
| 1955 | 0.6 | 0.2 | 0.2 | 0.1 | 266 | 2470 | 1210 | 1800 | 769 | 106 | 24 | 6.4 | 554.38 |
| 1956 | 0.6 | 0 | 1.2 | 0.2 | 23.5 | 3810 | 960 | 1050 | 508 | 123 | 27.5 | 8.1 | 542.68 |
| 1957 | 2.8 | 0.7 | 0.1 | 0.8 | 330 | 3940 | 2740 | 2180 | 747 | 163 | 31 | 8.2 | 845.3 |
| 1958 | 3.8 | 0.7 | 0.7 | 0.2 | 107 | 3890 | 3670 | 1980 | 833 | 151 | 22.5 | 1.4 | 888.36 |
| 1959 | 1.2 | 0.3 | -9999 | -9999 | 816 | 1880 | 5600 | 3950 | 2650 | 318 | 58 | 24 | -9999 |
| 1960 | 5 | 2.2 | 1.6 | 0.9 | 488 | 2130 | 3000 | 2200 | 1270 | 172 | 71.5 | 14 | 779.6 |
| 1961 | 2.1 | 0.5 | 0.2 | 0 | 168 | 5040 | 3330 | 4970 | 1190 | 480 | 69 | 11 | 1271.73 |
| 1962 | 0.7 | -9999 | 0 | 0.7 | 327 | 3150 | 3380 | 1750 | 672 | 97 | 41 | 5.9 | -9999 |
| 1963 | 1.8 | 1 | 0.2 | -9999 | 0.6 | 3980 | 3290 | 1050 | 812 | 135 | 38.5 | 7 | -9999 |
| 1964 | 2.6 | 0.9 | 0.4 | 0.1 | 21.5 | 4580 | 1910 | 2090 | 885 | 111 | 16.5 | 3 | 801.75 |
| 1965 | 1 | 0 | 0 | 0 | 425 | 3180 | 2820 | 1530 | 2220 | 231 | 38 | 9 | 871.17 |
| 1966 | 1 | 1 | 0 | 2 | 665 | 4090 | 3150 | 3400 | 1290 | 170 | 61 | 16 | 1070.5 |
| 1967 | 2 | 1 | 0 | 2 | 1380 | 5920 | 1800 | 2150 | 853 | 263 | 63 | 13 | 1037.25 |
| 1968 | 0.8 | 0.3 | 0.3 | 0.3 | 3130 | 3490 | 2850 | 3120 | 1590 | 57 | 4.3 | 0.8 | 1186.98 |
| 1969 | 0.3 | 0.2 | 0.1 | 0.1 | 944 | 4220 | 3090 | 2080 | 779 | 157 | 27 | 10 | 942.31 |
| 1970 | 3 | 0.9 | 0.5 | 0.7 | 1090 | 5990 | 2630 | 2230 | 893 | 201 | 43 | 13.5 | 1091.3 |
| 1971 | 4.2 | 0.8 | 0.8 | 0.2 | 1020 | 2570 | 2480 | 2230 | 856 | 72 | 5.3 | 0.8 | 770.01 |
| 1972 | 2.4 | 1.1 | 0.6 | 0.7 | 894 | 2060 | 4070 | 2140 | 1060 | 171 | 40.5 | 7.5 | 870.65 |
| 1973 | 1 | -9999 | -9999 | -9999 | 618 | 2820 | 2120 | 2830 | 2170 | 309 | 37.5 | 6.1 | -9999 |
| 1974 | 0.8 | 0.3 | 0.1 | 0.1 | 674 | 3800 | 2930 | 1820 | 617 | 143 | 13.5 | 2.6 | 833.45 |
| 1975 | 0.5 | -9999 | -9999 | -9999 | 782 | 2360 | 2100 | 2200 | 966 | 190 | 25.5 | 5.2 | -9999 |
| 1976 | 0.4 | 0 | 0 | 0 | 346 | 2530 | 3890 | 2270 | 2230 | 156 | 45 | 6.1 | 956.13 |
| 1977 | 1.3 | 0.2 | 0 | 0 | 1160 | 2260 | 4800 | 3020 | 2100 | 124 | 47 | 7.5 | 1126.67 |
| 1978 | 0.9 | 0.1 | 0 | 0 | 807 | 5770 | 4190 | 2580 | 1400 | 222 | 35 | 8.9 | 1251.16 |
| 1979 | 1 | 0.2 | 0 | 0 | 869 | 2980 | 2280 | 1930 | 606 | 94.5 | 16.5 | 5.4 | 731.88 |
| 1980 | 1.2 | 0.33 | 0.02 | 0 | 55 | 2480 | 2500 | 2440 | 1250 | 228 | 36.5 | 4.6 | 749.64 |
| 1981 | 0.63 | 0.16 | 0.19 | 0.11 | 1160 | 3170 | 2370 | 1280 | 562 | 82.5 | 28 | 4.6 | 721.52 |
| 1982 | 0.7 | 0.11 | 0 | 0 | 480 | 3220 | 1460 | 1990 | 1680 | 177 | 38.5 | 9.8 | 754.68 |
| 1983 | 3.4 | 2 | 0.73 | 0.56 | 488 | 1380 | 2240 | 2380 | 2530 | 586 | 75 | 15.5 | 808.43 |
| 1984 | 5.5 | 4 | 1.2 | 1.4 | 911 | 4140 | 3870 | 2640 | 1290 | 62 | 21 | 4 | 1079.18 |
| |
|
|
|
|
|
|
|
|
|
|
|
|
|
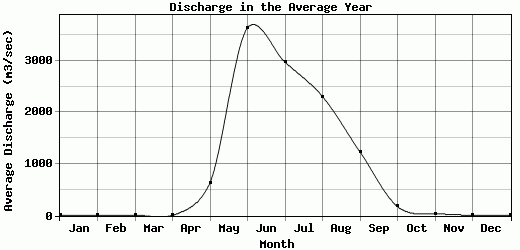
| Avg | 2.28 | 1.35 | 1.07 | 1.06 | 636.85 | 3636.17 | 2972.98 | 2305.02 | 1234.7 | 176.71 | 37.71 | 8.91 | 920.85 |
| |
|
|
|
|
|
|
|
|
|
|
|
|
|
| Std Dev | 1.96 |
2.02 |
2.13 |
2.12 |
565.8 |
1137.36 |
995.77 |
972.14 |
553.66 |
95.35 |
17.72 |
7 |
175.78 |
| |
|
|
|
|
|
|
|
|
|
|
|
|
|
| | Jan | Feb | Mar | Apr | May | Jun | Jul | Aug | Sep | Oct | Nov | Dec | Avg Annual |
Click here for this table in tab-delimited format.
Tab-delimited format will open in most table browsing software, i.e. Excel, etc.
View this station on the map.
Return to start.