Results
| Country: | U.S.A.
| | Station: | RAMPART AK | | River: | YUKON R | | Area: | 516415.39 | | Lat: | 65.5 | | Lon: | -150.17 | | Source: | USGS | | PointID: | 15468000 | | Area Units: | km2 | | Discharge Units: | m3/sec | | Starting Year: | 1957 | | Ending Year: | 1978 | | Total Years: | 22 | | Total Usable Years: | 21 | |
| |
| Year | Jan | Feb | Mar | Apr | May | Jun | Jul | Aug | Sep | Oct | Nov | Dec | Avg Annual |
|---|
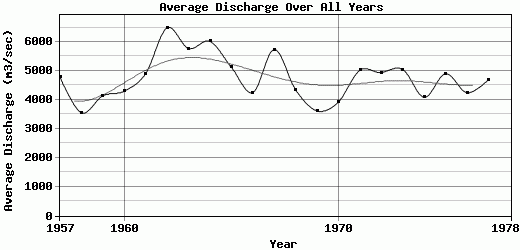
| 1957 | 1019.41 | 849.51 | 821.19 | 849.51 | 9216.73 | 14644.6 | 9120.81 | 7299.39 | 6979.2 | 3896.78 | 1755.65 | 946.34 | 4783.26 |
| 1958 | 1087.92 | 934.46 | 650.38 | 807.03 | 4763.65 | 10045 | 7082.9 | 7209.87 | 4931.88 | 2557.66 | 1330.9 | 1217.63 | 3551.61 |
| 1959 | 934.46 | 736.24 | 481.39 | 523.86 | 7431.84 | 10815.2 | 9136.34 | 7351.46 | 6218.41 | 3706.79 | 1373.37 | 932.63 | 4136.83 |
| 1960 | 850.42 | 694.25 | 651.29 | 835.35 | 7682.13 | 8443.19 | 8524.33 | 9051.39 | 7102.85 | 4996.58 | 1699.02 | 1062.34 | 4299.43 |
| 1961 | 1048.64 | 798.94 | 649.46 | 637.13 | 5857.97 | 13682.8 | 9872.58 | 10166.7 | 7181.19 | 5123.55 | 2237.04 | 1614.07 | 4905.84 |
| 1962 | 1415.85 | 1047.73 | 821.19 | 821.19 | 7472.03 | 20944.2 | 13869.8 | 11123.1 | 10478.2 | 5496.24 | 2775.07 | 1557.43 | 6485.17 |
| 1963 | 1161 | 991.1 | 849.51 | 679.61 | 9579.37 | 13042.8 | 13491.7 | 12858.7 | 7694.67 | 5652.44 | 2194.57 | 1019.41 | 5767.91 |
| 1964 | 962.78 | 934.46 | 877.83 | 849.51 | 2964.15 | 24497 | 15532.3 | 10664.5 | 7749.42 | 4242.07 | 1783.97 | 1161 | 6018.25 |
| 1965 | 1019.41 | 962.78 | 934.46 | 962.78 | 4139.76 | 15669.7 | 10852.7 | 9705.42 | 9028.4 | 5616.82 | 1628.23 | 991.1 | 5125.96 |
| 1966 | 821.19 | 651.29 | 566.34 | 736.24 | 6869.16 | 13946.1 | 9214.9 | 6387.77 | 4781.8 | 3729.62 | 2133.21 | 1161 | 4249.89 |
| 1967 | 877.83 | 736.24 | 707.93 | 764.56 | 7383.43 | 16260.6 | 10803.4 | 13375.7 | 8703.7 | 4742.64 | 2641.03 | 1818.68 | 5734.65 |
| 1968 | 1161 | 876.85 | 849.51 | 849.51 | 3439.15 | 15070.3 | 9530.04 | 6855.45 | 5421.76 | 4079.47 | 2435.26 | 1522.72 | 4340.92 |
| 1969 | 1010.28 | 742.31 | 631.2 | 712.64 | 4533.46 | 8045.8 | 7033.58 | 7736.02 | 5610.54 | 3736.93 | 2204.01 | 1407.63 | 3617.03 |
| 1970 | 1013.93 | 843.44 | 749.94 | 736.24 | 4764.56 | 9378.59 | 9156.44 | 7771.65 | 6190.1 | 3859.33 | 1655.6 | 993.84 | 3926.14 |
| 1971 | 906.14 | 839.4 | 758.16 | 830.63 | 11035.4 | 14853.2 | 8941.78 | 8735.34 | 6194.82 | 3969.86 | 1892.52 | 1342.77 | 5025 |
| 1972 | 1142.73 | 908.1 | 735.33 | 679.61 | 6072.63 | 16623 | 10297.3 | 7890.39 | 7081.14 | 3869.38 | 2369.19 | 1644.21 | 4942.75 |
| 1973 | 1246.86 | 1031.55 | 881.48 | 896.7 | 10330.2 | 13316.5 | 9547.4 | 8581.88 | 7498.34 | 3760.68 | 2100.18 | 1381.14 | 5047.74 |
| 1974 | 1055.04 | 852.54 | 739.9 | 724.92 | 7395.3 | 8897.2 | 7493.04 | 8492.36 | 6248.62 | 3809.09 | 1982.19 | 1342.77 | 4086.08 |
| 1975 | 1059.6 | 849.51 | 707.93 | 707.93 | 6024.21 | 14183 | 10441.7 | 9110.76 | 7815.49 | 4922.59 | 1785.86 | 1215.8 | 4902.03 |
| 1976 | 986.53 | 867.09 | 732.59 | 858.95 | 7187.04 | 10264.9 | 9007.55 | 8163.52 | 5672.84 | 3556.07 | 2133.21 | 1505.37 | 4244.64 |
| 1977 | 1300.76 | 1136.73 | 990.18 | 962.78 | 5140.91 | 15102.4 | 9340.96 | 7359.68 | 5561.46 | 4839.47 | 2737.31 | 1875.32 | 4695.66 |
| 1978 | -9999 | -9999 | -9999 | -9999 | -9999 | -9999 | -9999 | -9999 | -9999 | -9999 | -9999 | -9999 | -9999 |
| |
|
|
|
|
|
|
|
|
|
|
|
|
|
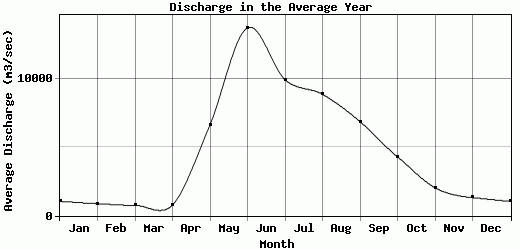
| Avg | 1051.51 | 870.69 | 751.77 | 782.22 | 6632.53 | 13701.2 | 9918.65 | 8851.95 | 6864.04 | 4293.53 | 2040.35 | 1319.68 | 4756.51 |
| |
|
|
|
|
|
|
|
|
|
|
|
|
|
| Std Dev | 145.16 |
119.63 |
121.34 |
105.14 |
2150.74 |
3962.92 |
2080.41 |
1841.27 |
1391.54 |
782.24 |
401.18 |
278.24 |
759.37 |
| |
|
|
|
|
|
|
|
|
|
|
|
|
|
| | Jan | Feb | Mar | Apr | May | Jun | Jul | Aug | Sep | Oct | Nov | Dec | Avg Annual |
Click here for this table in tab-delimited format.
Tab-delimited format will open in most table browsing software, i.e. Excel, etc.
View this station on the map.
Return to start.