Results
| Country: | U.S.A.
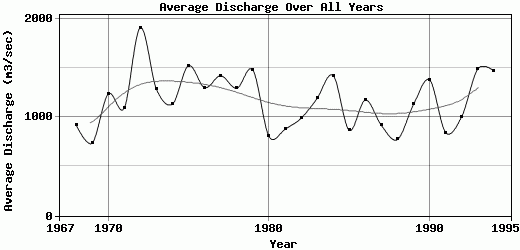
| | Station: | CONOWINGO, MD | | River: | SUSQUEHANNA R | | Area: | 5309977.80 | | Lat: | 39.65 | | Lon: | -76.17 | | Source: | USGS | | PointID: | 1578310 | | Area Units: | km2 | | Discharge Units: | m3/sec | | Starting Year: | 1967 | | Ending Year: | 1995 | | Total Years: | 29 | | Total Usable Years: | 28 | |
| |
| Year | Jan | Feb | Mar | Apr | May | Jun | Jul | Aug | Sep | Oct | Nov | Dec | Avg Annual |
|---|
| 1967 | -9999 | -9999 | -9999 | -9999 | -9999 | -9999 | -9999 | -9999 | -9999 | 743.8 | 1260.01 | 1411.47 | -9999 |
| 1968 | 600.02 | 1169.64 | 1605.61 | 1060.25 | 1384.99 | 1590.28 | 556.42 | 178.06 | 413.66 | 216.8 | 1265.74 | 1026.28 | 922.31 |
| 1969 | 708.61 | 845.82 | 801.86 | 1728.56 | 1027.45 | 606.03 | 457.63 | 553.7 | 191.82 | 157.36 | 790.35 | 972.23 | 736.79 |
| 1970 | 584.06 | 2058.14 | 1527.47 | 3927 | 1273.72 | 668.72 | 640.33 | 312.15 | 259.06 | 547.67 | 1698.36 | 1307.7 | 1233.7 |
| 1971 | 853.04 | 2112.45 | 2941.95 | 1834.28 | 1337.57 | 483.77 | 218.36 | 419.33 | 334.75 | 312.17 | 551.5 | 1703.59 | 1091.9 |
| 1972 | 1337.84 | 956.53 | 3133.6 | 2507.19 | 2005.76 | 5889.75 | 1672.26 | 397.54 | 221.68 | 236.73 | 1522.17 | 2963.51 | 1903.71 |
| 1973 | 1511.95 | 1806.07 | 1865.27 | 2274.89 | 1704.68 | 1095.96 | 560.13 | 397.66 | 471.8 | 443.07 | 793.99 | 2475.18 | 1283.39 |
| 1974 | 2032.34 | 1383.29 | 1739.3 | 2616.77 | 1143 | 550.92 | 634.71 | 319.44 | 600.14 | 355.29 | 651.32 | 1556.61 | 1131.93 |
| 1975 | 1545.19 | 2392.28 | 2336.43 | 1443.98 | 1660.93 | 1275.87 | 604.1 | 286.75 | 2504.53 | 1915.14 | 1191.3 | 1088.93 | 1520.45 |
| 1976 | 1429.75 | 2810.02 | 1850.47 | 1263.03 | 992.37 | 1109.08 | 706.1 | 576.88 | 385.99 | 2316.33 | 1338.26 | 787.75 | 1297.17 |
| 1977 | 338 | 711.88 | 3632.07 | 2451.97 | 832.44 | 370.37 | 535.18 | 383.31 | 959.45 | 2125.78 | 2071.96 | 2601.78 | 1417.85 |
| 1978 | 2547.16 | 1044.8 | 3244.49 | 2664.06 | 2351.13 | 797.35 | 400.3 | 491.18 | 316.44 | 322.7 | 410.27 | 912 | 1291.82 |
| 1979 | 2865.77 | 1347.25 | 4044.4 | 1844.85 | 1242.75 | 760.26 | 367.3 | 457.08 | 791.92 | 1384.43 | 1366.36 | 1250.81 | 1476.93 |
| 1980 | 769.4 | 369.66 | 1992.11 | 3060.97 | 1316.47 | 495.57 | 349.03 | 239.28 | 134.14 | 177.51 | 277.6 | 474.96 | 804.72 |
| 1981 | 202.86 | 2943.19 | 1004.42 | 1041.59 | 1263.8 | 858.76 | 464.64 | 253.15 | 259.25 | 611.1 | 948.86 | 654.99 | 875.55 |
| 1982 | 754.32 | 1522.34 | 2439.28 | 2131.14 | 676.69 | 2143.03 | 576.08 | 268.76 | 183.17 | 171.16 | 319.83 | 657.87 | 986.97 |
| 1983 | 556.87 | 1295 | 1434.48 | 3473.93 | 2287.74 | 938.8 | 495.02 | 212.98 | 150.56 | 195.86 | 641.63 | 2589.64 | 1189.38 |
| 1984 | 594.97 | 3278.03 | 1581 | 3708.39 | 1981.82 | 1502.24 | 1095.09 | 816.21 | 273.14 | 226.07 | 429.99 | 1557.71 | 1420.39 |
| 1985 | 844.35 | 1036.11 | 1591.51 | 1476.83 | 693.18 | 478.06 | 303.07 | 219.69 | 297 | 404.51 | 1507.58 | 1528.39 | 865.02 |
| 1986 | 903.06 | 1871.35 | 2878.65 | 1724.79 | 785.46 | 875.49 | 510.63 | 538.95 | 222.28 | 469.82 | 1436.13 | 1852.3 | 1172.41 |
| 1987 | 835.53 | 642.11 | 1632.06 | 2576.28 | 798.62 | 453.23 | 510.11 | 187.4 | 889.64 | 514.28 | 710.61 | 1218.45 | 914.03 |
| 1988 | 665.44 | 1558.41 | 1384.52 | 1038.37 | 1754.38 | 441.04 | 270.85 | 246.5 | 381.86 | 226.42 | 812.67 | 486.21 | 772.22 |
| 1989 | 654.87 | 761.12 | 1195.16 | 1825.31 | 3062.71 | 1971.34 | 1228.59 | 397.39 | 285.07 | 766.89 | 962.97 | 414.29 | 1127.14 |
| 1990 | 1156.09 | 2543.37 | 1103.27 | 1556.59 | 1628.41 | 830.19 | 797.36 | 617.97 | 487.7 | 2065.56 | 1445.68 | 2260.61 | 1374.4 |
| 1991 | 2051.61 | 1497.16 | 2103.77 | 1559.7 | 891.01 | 245.1 | 172.94 | 167.83 | 155.67 | 181.16 | 319.45 | 763.71 | 842.43 |
| 1992 | 751.62 | 628.97 | 1779.49 | 1928.29 | 944.6 | 726.3 | 610.68 | 629.68 | 595.33 | 611.19 | 1499.86 | 1355.2 | 1005.1 |
| 1993 | 1849.74 | 566.8 | 2355.88 | 7082.08 | 1313.57 | 409.72 | 236.38 | 196.14 | 274.97 | 368.71 | 1236.7 | 1950.49 | 1486.76 |
| 1994 | 544.14 | 1525.68 | 4185.98 | 4186.57 | 1056.5 | 733.43 | 687.1 | 1375.74 | 562.73 | 426.53 | 725.2 | 1575.61 | 1465.43 |
| 1995 | 1760.4 | 707.72 | 1342.87 | 958.62 | 657.5 | 571.1 | 435.55 | 174.84 | 98.42 | -9999 | -9999 | -9999 | -9999 |
| |
|
|
|
|
|
|
|
|
|
|
|
|
|
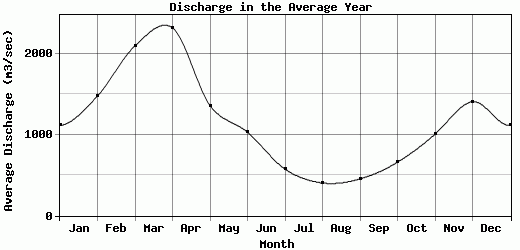
| Avg | 1116.04 | 1478.04 | 2097.41 | 2319.51 | 1359.62 | 1031.13 | 574.86 | 404.13 | 453.65 | 660.5 | 1006.66 | 1407.08 | 1170.74 |
| |
|
|
|
|
|
|
|
|
|
|
|
|
|
| Std Dev | 665.49 |
768.26 |
892.74 |
1267.05 |
570.86 |
1043.91 |
313.27 |
248.92 |
451.85 |
642.57 |
468.29 |
685.75 |
280.24 |
| |
|
|
|
|
|
|
|
|
|
|
|
|
|
| | Jan | Feb | Mar | Apr | May | Jun | Jul | Aug | Sep | Oct | Nov | Dec | Avg Annual |
Click here for this table in tab-delimited format.
Tab-delimited format will open in most table browsing software, i.e. Excel, etc.
View this station on the map.
Return to start.