Results
|
|
| Year | Jan | Feb | Mar | Apr | May | Jun | Jul | Aug | Sep | Oct | Nov | Dec | Avg Annual |
|---|---|---|---|---|---|---|---|---|---|---|---|---|---|
| 1935 | -9999 | -9999 | -9999 | 489.47 | 188.26 | 144.62 | 147.49 | 91.46 | 210.82 | 75.36 | 171.5 | 163.76 | -9999 |
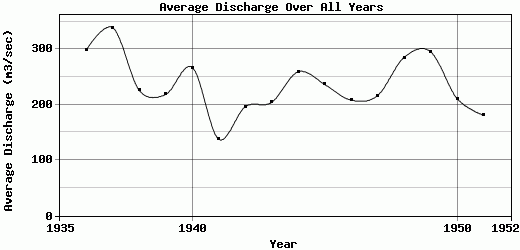
| 1936 | 922.05 | 575.69 | 594.8 | 480.78 | 151.42 | 137.73 | 103.94 | 119.62 | 55.95 | 166.73 | 79.69 | 199.84 | 299.02 |
| 1937 | 870.2 | 336.5 | 206.28 | 377.34 | 213.92 | 169.22 | 157.44 | 364.05 | 287.1 | 638.27 | 252.38 | 190.55 | 338.6 |
| 1938 | 284.24 | 195.34 | 241.16 | 189.26 | 138.91 | 397.95 | 495.63 | 199.4 | 95.16 | 80.22 | 178.65 | 214.87 | 225.9 |
| 1939 | 191.76 | 507.5 | 416.58 | 215.69 | 191.37 | 136.91 | 229.5 | 342.61 | 88.64 | 82.45 | 107.27 | 113.6 | 218.66 |
| 1940 | 144.01 | 353.65 | 182.71 | 284.13 | 165.02 | 258.89 | 133.31 | 1008.36 | 174.78 | 94.14 | 231.16 | 176.24 | 267.2 |
| 1941 | 225.09 | 150.73 | 181.86 | 251.91 | 93.81 | 107.93 | 294.95 | 86.46 | 71.45 | 41.57 | 54.97 | 94.25 | 137.92 |
| 1942 | 108.72 | 155.86 | 203 | 100.19 | 312.66 | 215.38 | 119.67 | 356.94 | 156.95 | 243.96 | 137.05 | 245.22 | 196.3 |
| 1943 | 296.43 | 441.73 | 366.39 | 319.64 | 191.73 | 208.56 | 245.2 | 85.85 | 68.74 | 57.47 | 82.08 | 87.19 | 204.25 |
| 1944 | 181.58 | 303.73 | 546.34 | 359.96 | 203.01 | 103.52 | 105.15 | 71.84 | 464.8 | 393.45 | 150.29 | 227.3 | 259.25 |
| 1945 | 305.81 | 347.82 | 223.08 | 194.31 | 190.46 | 96.85 | 152.11 | 101.15 | 543.49 | 121.34 | 155.53 | 407.75 | 236.64 |
| 1946 | 453.06 | 441.16 | 246.5 | 191.33 | 337.92 | 148.84 | 180.96 | 92.51 | 89.15 | 93.16 | 112.53 | 112.69 | 208.32 |
| 1947 | 402.33 | 137.67 | 286.71 | 270.84 | 149.02 | 140.84 | 108.19 | 104.13 | 227.75 | 232.22 | 382.05 | 155.12 | 216.41 |
| 1948 | 201.84 | 506.61 | 388.36 | 459.37 | 227.29 | 223.04 | 127.16 | 180.15 | 88.97 | 163.11 | 295.28 | 562.52 | 285.31 |
| 1949 | 404.12 | 367.36 | 323.08 | 331.35 | 402.95 | 184.01 | 431.15 | 241.01 | 215.82 | 172.83 | 307.86 | 167.28 | 295.74 |
| 1950 | 176.53 | 258.34 | 232.03 | 152.65 | 332.58 | 268.71 | 226.26 | 120.36 | 229.09 | 132.71 | 115.68 | 290.23 | 211.26 |
| 1951 | 140.74 | 251.38 | 272.14 | 416.45 | 161.22 | 215.87 | 125.29 | 86.23 | 56.59 | 47.34 | 105.24 | 292.45 | 180.91 |
| 1952 | 304.75 | 321.03 | 545.19 | 315.73 | 238.93 | 117.25 | 104.97 | 179.69 | 247.87 | -9999 | -9999 | -9999 | -9999 |
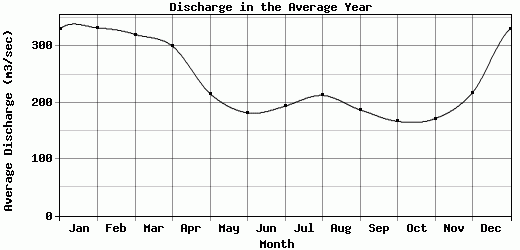
| Avg | 330.19 | 332.48 | 320.95 | 300.02 | 216.14 | 182.01 | 193.8 | 212.88 | 187.4 | 166.84 | 171.72 | 217.7 | 236.36 |
| Std Dev | 228.05 | 128.29 | 130.68 | 112.08 | 78.64 | 73.09 | 109.91 | 215.41 | 133.89 | 146.08 | 89.25 | 117.07 | 49.63 |
| Jan | Feb | Mar | Apr | May | Jun | Jul | Aug | Sep | Oct | Nov | Dec | Avg Annual |
Click here for this table in tab-delimited format.
Tab-delimited format will open in most table browsing software, i.e. Excel, etc.