Results
| Country: | U.S.A.
| | Station: | LOCK # 1 NR KELLY, NC | | River: | CAPE FEAR R | | Area: | 13609.64 | | Lat: | 34.4 | | Lon: | -78.29 | | Source: | USGS | | PointID: | 2105769 | | Area Units: | km2 | | Discharge Units: | m3/sec | | Starting Year: | 1969 | | Ending Year: | 1993 | | Total Years: | 25 | | Total Usable Years: | 21 | |
| |
| Year | Jan | Feb | Mar | Apr | May | Jun | Jul | Aug | Sep | Oct | Nov | Dec | Avg Annual |
|---|
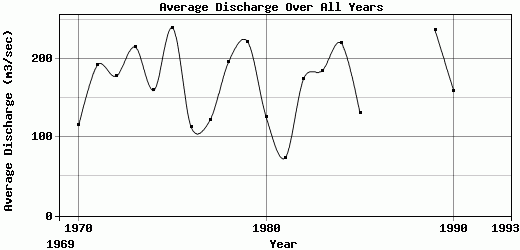
| 1969 | -9999 | -9999 | -9999 | -9999 | -9999 | -9999 | 73.21 | 184.13 | 104.43 | 103.66 | 56.7 | 110.81 | -9999 |
| 1970 | 107.71 | 292.93 | 201.59 | 225.49 | 93.3 | 33.13 | 49.04 | 127.91 | 29.19 | 32.1 | 109.89 | 78.18 | 115.04 |
| 1971 | 219.16 | 406 | 399.31 | 193.64 | 204.92 | 59.12 | 41.65 | 125.15 | 64.8 | 333.01 | 127.52 | 128.36 | 191.89 |
| 1972 | 191.85 | 354.4 | 138.54 | 166.44 | 204.43 | 159.03 | 76.27 | 67.92 | 46.61 | 77.29 | 219.15 | 429.62 | 177.63 |
| 1973 | 295.55 | 559.9 | 377.17 | 529.77 | 151.96 | 222.33 | 173.48 | 81.87 | 33.49 | 23.43 | 26.82 | 104.44 | 215.02 |
| 1974 | 201.81 | 340.33 | 137.71 | 215.2 | 192.56 | 97.17 | 51.81 | 213.87 | 188.64 | 44.65 | 55.35 | 180.87 | 160 |
| 1975 | 491.56 | 367.14 | 542.61 | 224.1 | 127.95 | 92.94 | 454.19 | 64.01 | 154.4 | 117.67 | 100.79 | 136.96 | 239.53 |
| 1976 | 258.38 | 212.78 | 123.59 | 67.97 | 74.51 | 165.85 | 44.47 | 27.08 | 22.91 | 67.91 | 49.21 | 234.66 | 112.44 |
| 1977 | 227.93 | 84.62 | 358.02 | 186.69 | 61.78 | 49.31 | 22.38 | 41.06 | 98.52 | 80.89 | 100.86 | 147.94 | 121.67 |
| 1978 | 535.03 | 252.27 | 320.01 | 184.65 | 495.87 | 130.97 | 108.66 | 99.01 | 44.23 | 26.24 | 38.02 | 120.92 | 196.32 |
| 1979 | 327.39 | 280.36 | 598.2 | 229.19 | 220.07 | 156.93 | 66.08 | 30.99 | 273.15 | 107.62 | 252.13 | 121.81 | 221.99 |
| 1980 | 257.99 | 172.91 | 388.49 | 245.23 | 105.71 | 73.12 | 69.33 | 22.66 | 24.08 | 41.65 | 49.43 | 52.28 | 125.24 |
| 1981 | 59.19 | 182.42 | 75.64 | 46.59 | 30.95 | 41.39 | 83.27 | 111.35 | 65.14 | 41.99 | 43.44 | 101.47 | 73.57 |
| 1982 | 316.49 | 314.77 | 311.42 | 116.17 | 142.26 | 426.78 | 90.67 | 85.53 | 28.39 | 46.02 | 47.6 | 171.96 | 174.84 |
| 1983 | 157.23 | 424.01 | 516.08 | 399.21 | 145.6 | 69.5 | 47.17 | 29.63 | 31.81 | 32.26 | 56.37 | 313.03 | 185.16 |
| 1984 | 363.53 | 365.63 | 475.54 | 480.85 | 134.14 | 141.15 | 235.41 | 223.21 | 78.2 | 45.26 | 40.83 | 54.79 | 219.88 |
| 1985 | 138.57 | 374.26 | 108.65 | 48.4 | 52.18 | 43.94 | 74.04 | 188.78 | 58.58 | 45.86 | 233.89 | 200.96 | 130.68 |
| 1986 | 64.13 | 85.67 | 154.61 | 47.2 | 36.01 | 32.48 | 29.62 | 88.76 | 37.18 | -9999 | -9999 | -9999 | -9999 |
| 1987 | -9999 | -9999 | -9999 | -9999 | -9999 | -9999 | -9999 | -9999 | -9999 | -9999 | -9999 | -9999 | -9999 |
| 1988 | -9999 | -9999 | -9999 | -9999 | -9999 | -9999 | -9999 | -9999 | -9999 | 64.45 | 104.41 | 54.88 | -9999 |
| 1989 | 92.35 | 173.82 | 570.37 | 353.13 | 342.78 | 164.04 | 199.97 | 158.32 | 101.71 | 276.13 | 143.22 | 265.62 | 236.79 |
| 1990 | 249.22 | 361.08 | 198.85 | 270.06 | 207.15 | 108.52 | 36.96 | 46.74 | 27.88 | 168.27 | 90.87 | 143.04 | 159.05 |
| 1991 | 376.22 | 136.57 | 275.31 | 256.97 | 95.67 | 61.33 | 68.38 | 107.08 | 59.13 | -9999 | -9999 | -9999 | -9999 |
| 1992 | -9999 | -9999 | -9999 | -9999 | -9999 | -9999 | -9999 | -9999 | -9999 | 50.9 | 193.97 | 209.44 | -9999 |
| 1993 | 430.2 | 206.26 | 518.71 | 501.98 | 93.14 | 57.31 | 45.86 | 35.49 | 36.89 | -9999 | -9999 | -9999 | -9999 |
| |
|
|
|
|
|
|
|
|
|
|
|
|
|
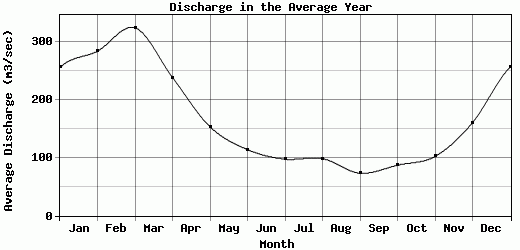
| Avg | 255.31 | 283.24 | 323.35 | 237.57 | 153 | 113.64 | 97.36 | 98.21 | 73.15 | 87.01 | 101.93 | 160.1 | 169.82 |
| |
|
|
|
|
|
|
|
|
|
|
|
|
|
| Std Dev | 130.41 |
118.56 |
165.39 |
141.54 |
105.78 |
87.45 |
94.53 |
61.24 |
60.79 |
79.16 |
67.75 |
90.46 |
46.98 |
| |
|
|
|
|
|
|
|
|
|
|
|
|
|
| | Jan | Feb | Mar | Apr | May | Jun | Jul | Aug | Sep | Oct | Nov | Dec | Avg Annual |
Click here for this table in tab-delimited format.
Tab-delimited format will open in most table browsing software, i.e. Excel, etc.
View this station on the map.
Return to start.