Results
| Country: | U.S.A.
| | Station: | JACKSONVILLE, FLA. | | River: | ST. JOHNS RIVER | | Area: | 22920.14 | | Lat: | 30.32 | | Lon: | -81.66 | | Source: | USGS | | PointID: | 2246500 | | Area Units: | km2 | | Discharge Units: | m3/sec | | Starting Year: | 1971 | | Ending Year: | 1993 | | Total Years: | 23 | | Total Usable Years: | 10 | |
| |
| Year | Jan | Feb | Mar | Apr | May | Jun | Jul | Aug | Sep | Oct | Nov | Dec | Avg Annual |
|---|
| 1971 | -9999 | -9999 | -9999 | -9999 | -9999 | -9999 | -9999 | -9999 | -9999 | 573.04 | 200.33 | -9999 | -9999 |
| 1972 | -9999 | 38.14 | -9999 | 102.03 | 6.85 | 286.13 | 374.57 | 225.5 | 226.27 | 47.2 | 100.66 | 275.95 | -9999 |
| 1973 | 294.27 | 310.96 | 165.81 | 239.67 | -9999 | -9999 | 52.91 | 182.3 | 264.68 | 324.37 | 7.54 | 27.79 | -9999 |
| 1974 | -9999 | -9999 | -9999 | -9999 | 1.22 | 128.07 | 642.7 | 722.52 | 386.37 | 410.1 | 163.18 | 179.34 | -9999 |
| 1975 | 46.21 | 13.11 | 134.79 | 326.92 | 336.85 | 543.07 | 689.56 | 524.87 | 593.05 | -9999 | -9999 | -9999 | -9999 |
| 1976 | -9999 | -9999 | -9999 | -9999 | -9999 | -9999 | -9999 | -9999 | -9999 | -9999 | -9999 | -9999 | -9999 |
| 1977 | -9999 | -9999 | -9999 | -9999 | -9999 | -9999 | -9999 | -9999 | -9999 | -9999 | -9999 | -9999 | -9999 |
| 1978 | -9999 | -9999 | -9999 | -9999 | -9999 | -9999 | -9999 | -9999 | -9999 | -9999 | -9999 | -9999 | -9999 |
| 1979 | 639.45 | 343.37 | 220.25 | 86.23 | 1498.79 | 2598.47 | -9999 | -9999 | -9999 | -9999 | 1272.19 | 137.19 | -9999 |
| 1980 | 220.62 | 212.22 | 282.74 | -9999 | -9999 | -9999 | 350.95 | -9999 | -9999 | 309.68 | 115.52 | 237.03 | -9999 |
| 1981 | 145.6 | 411.57 | -9999 | 294.47 | 347.42 | 182.18 | 103.59 | 49.71 | -9999 | 179.83 | -9999 | -9999 | -9999 |
| 1982 | -9999 | -9999 | 298.18 | -9999 | -9999 | -9999 | 1651.79 | 706.41 | 693.55 | 748.42 | 101.29 | -9999 | -9999 |
| 1983 | 1336.56 | 248.42 | 264.71 | -9999 | -9999 | -9999 | -9999 | -9999 | -9999 | -9999 | -9999 | -9999 | -9999 |
| 1984 | -9999 | -9999 | -9999 | -9999 | -9999 | -9999 | -9999 | -9999 | -9999 | 438.75 | -9999 | -9999 | -9999 |
| 1985 | -9999 | -9999 | -9999 | -9999 | -9999 | -9999 | -9999 | -9999 | -9999 | -9999 | -9999 | -9999 | -9999 |
| 1986 | -9999 | -9999 | -9999 | -9999 | -9999 | -9999 | -9999 | -9999 | -9999 | -9999 | -9999 | -9999 | -9999 |
| 1987 | -9999 | -9999 | -9999 | -9999 | -9999 | -9999 | -9999 | -9999 | -9999 | -9999 | -9999 | -9999 | -9999 |
| 1988 | -9999 | -9999 | -9999 | -9999 | -9999 | -9999 | -9999 | -9999 | -9999 | -9999 | -9999 | -9999 | -9999 |
| 1989 | -9999 | -9999 | -9999 | -9999 | -9999 | -9999 | -9999 | -9999 | -9999 | 180.71 | 245.9 | 222.72 | -9999 |
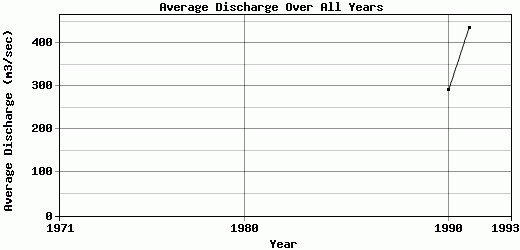
| 1990 | 266.79 | 197.98 | 139.56 | 154.65 | 48.75 | 573.35 | 292.77 | 240.99 | 120.24 | 475.62 | 471.61 | 509.44 | 290.98 |
| 1991 | 477.1 | 362.13 | 403.56 | 449.33 | 423.66 | 476.14 | 394.88 | 417.34 | 332.11 | 573.14 | 529.63 | 393.05 | 436.01 |
| 1992 | 565.09 | 421.82 | 632.36 | 468.65 | 259.22 | 390.77 | 165.98 | 258.96 | 504.04 | -9999 | -9999 | -9999 | -9999 |
| 1993 | -9999 | 34.97 | -9999 | 457.34 | 544.06 | 636.87 | 813.64 | 373.69 | 362.2 | -9999 | -9999 | -9999 | -9999 |
| |
|
|
|
|
|
|
|
|
|
|
|
|
|
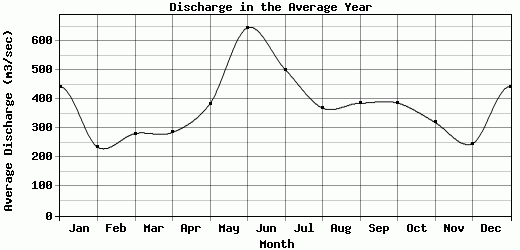
| Avg | 443.52 | 235.88 | 282.44 | 286.59 | 385.2 | 646.12 | 503.03 | 370.23 | 386.95 | 387.35 | 320.79 | 247.81 | 363.5 |
| |
|
|
|
|
|
|
|
|
|
|
|
|
|
| Std Dev | 365.39 |
144.54 |
148.08 |
143.1 |
433.36 |
709.85 |
430.83 |
212.45 |
171.82 |
195.82 |
354.03 |
139.83 |
72.52 |
| |
|
|
|
|
|
|
|
|
|
|
|
|
|
| | Jan | Feb | Mar | Apr | May | Jun | Jul | Aug | Sep | Oct | Nov | Dec | Avg Annual |
Click here for this table in tab-delimited format.
Tab-delimited format will open in most table browsing software, i.e. Excel, etc.
View this station on the map.
Return to start.