Results
| Country: | India
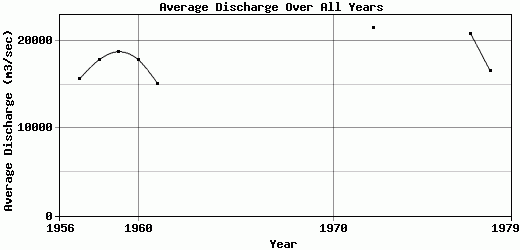
| | Station: | Panda | | River: | Brahmaputra | | Area: | 405000 km2 | | Lat: | 26.13 | | Lon: | 91.7 | | Source: | RivDIS | | PointID: | 883 | | Area Units: | km2 | | Discharge Units: | m3/sec | | Starting Year: | 1956 | | Ending Year: | 1979 | | Total Years: | 24 | | Total Usable Years: | 15 | |
| |
| Year | Jan | Feb | Mar | Apr | May | Jun | Jul | Aug | Sep | Oct | Nov | Dec | Avg Annual |
|---|
| 1956 | 3970 | -9999 | 5670 | 7650 | 25400 | 23180 | 27400 | 22700 | 33200 | 15500 | 7950 | 4400 | -9999 |
| 1957 | 3800 | 3638 | 4030 | 7250 | 21000 | 25360 | 40000 | 35400 | 18600 | 16800 | 7120 | 5100 | 15674.8 |
| 1958 | 3950 | 3780 | 3860 | 6260 | 19900 | 21800 | 37800 | 46800 | 33400 | 22500 | 9060 | 5130 | 17853.3 |
| 1959 | 3830 | 3320 | 3860 | 8600 | 21000 | 36200 | 56500 | 39000 | 21400 | 19200 | 8200 | 4380 | 18790.8 |
| 1960 | 3170 | 3120 | 3570 | 6050 | 10500 | 32300 | 42700 | 40500 | 45000 | 17800 | 5660 | 4225 | 17882.9 |
| 1961 | 3650 | 3495 | 5060 | 8000 | 14650 | 23900 | 28400 | 43000 | 23100 | 17000 | 6950 | 4270 | 15122.9 |
| 1962 | 3375 | 2840 | 3600 | 15600 | 12800 | 29700 | 38400 | 47400 | 31900 | 13550 | 3970 | -9999 | -9999 |
| 1963 | -9999 | -9999 | 3970 | 6500 | 10600 | 21900 | 41000 | 41600 | -9999 | 21200 | 8300 | 4190 | -9999 |
| 1964 | -9999 | -9999 | -9999 | -9999 | -9999 | -9999 | -9999 | -9999 | -9999 | -9999 | -9999 | -9999 | -9999 |
| 1965 | -9999 | -9999 | -9999 | -9999 | -9999 | -9999 | -9999 | -9999 | -9999 | -9999 | -9999 | -9999 | -9999 |
| 1966 | -9999 | -9999 | -9999 | -9999 | -9999 | -9999 | -9999 | -9999 | -9999 | -9999 | -9999 | -9999 | -9999 |
| 1967 | -9999 | -9999 | -9999 | -9999 | -9999 | -9999 | -9999 | -9999 | -9999 | -9999 | -9999 | -9999 | -9999 |
| 1968 | -9999 | -9999 | -9999 | -9999 | -9999 | -9999 | -9999 | -9999 | -9999 | -9999 | -9999 | -9999 | -9999 |
| 1969 | -9999 | -9999 | -9999 | -9999 | -9999 | -9999 | -9999 | -9999 | -9999 | -9999 | -9999 | -9999 | -9999 |
| 1970 | -9999 | -9999 | -9999 | -9999 | -9999 | -9999 | -9999 | -9999 | -9999 | -9999 | -9999 | -9999 | -9999 |
| 1971 | -9999 | -9999 | -9999 | -9999 | 9063 | 25136 | 24831 | 30833 | 22435 | 19747 | 10156 | 5554 | -9999 |
| 1972 | 4397 | 5713 | 9696 | 15137 | 22231 | 40449 | 47734 | 47527 | 32107 | 19607 | 9783 | 3873 | 21521.2 |
| 1973 | 2752 | 4961 | 6556 | 14625 | 20362 | 44598 | 33615 | 51100 | 34760 | 18236 | 6666 | -9999 | -9999 |
| 1974 | -9999 | -9999 | 7366 | 17168 | -9999 | 49470 | 51200 | 49476 | 53286 | 31075 | 18146 | -9999 | -9999 |
| 1975 | -9999 | -9999 | -9999 | -9999 | -9999 | -9999 | -9999 | -9999 | -9999 | -9999 | -9999 | -9999 | -9999 |
| 1976 | -9999 | 4367 | 6899 | 9903 | 14209 | 26557 | 41243 | 29679 | 25794 | 17978 | 13219 | 10433 | -9999 |
| 1977 | 6977 | 5470 | 7349 | 13634 | 20513 | 31005 | 37476 | 44583 | 35111 | 24935 | 12381 | 10470 | 20825.3 |
| 1978 | 8720 | 7983 | 8082 | 11150 | 15870 | 28136 | 29886 | 28219 | 24491 | 17484 | 10269 | 8365 | 16554.6 |
| 1979 | 6929 | 6231 | 6965 | 10779 | 16024 | 17285 | 37967 | 49210 | 33619 | 30736 | 1033 | -9999 | -9999 |
| |
|
|
|
|
|
|
|
|
|
|
|
|
|
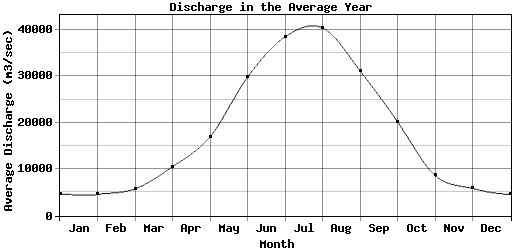
| Avg | 4626.67 | 4576.5 | 5768.87 | 10553.7 | 16941.5 | 29811 | 38509.5 | 40439.2 | 31213.5 | 20209.2 | 8678.94 | 5865.83 | 18028.2 |
| |
|
|
|
|
|
|
|
|
|
|
|
|
|
| Std Dev | 1779.44 |
1472.63 |
1875.22 |
3669.24 |
4770.14 |
8603.72 |
8352.31 |
8426.19 |
8920.66 |
4806.13 |
3792.6 |
2343.49 |
2145.01 |
| |
|
|
|
|
|
|
|
|
|
|
|
|
|
| | Jan | Feb | Mar | Apr | May | Jun | Jul | Aug | Sep | Oct | Nov | Dec | Avg Annual |
Click here for this table in tab-delimited format.
Tab-delimited format will open in most table browsing software, i.e. Excel, etc.
View this station on the map.
Return to start.