Results
| Country: | U.S.A.
| | Station: | COLUMBIA, AL | | River: | CHATTAHOOCHEE R | | Area: | 20822.37 | | Lat: | 31.29 | | Lon: | -85.09 | | Source: | USGS | | PointID: | 2343500 | | Area Units: | km2 | | Discharge Units: | m3/sec | | Starting Year: | 1928 | | Ending Year: | 1960 | | Total Years: | 33 | | Total Usable Years: | 32 | |
| |
| Year | Jan | Feb | Mar | Apr | May | Jun | Jul | Aug | Sep | Oct | Nov | Dec | Avg Annual |
|---|
| 1928 | -9999 | -9999 | -9999 | -9999 | -9999 | -9999 | 240.81 | 354.06 | 326.08 | 159.94 | 137.91 | 158.5 | -9999 |
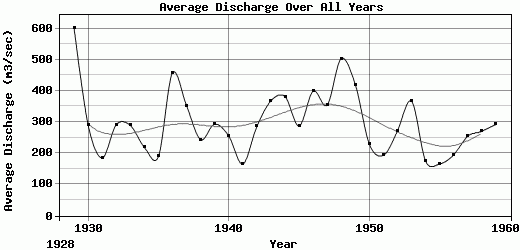
| 1929 | 276.15 | 629.67 | 2821.38 | 498.47 | 560.68 | 305.52 | 253.26 | 216.93 | 236.54 | 553.01 | 479.86 | 388.11 | 601.63 |
| 1930 | 379.76 | 425.79 | 557.66 | 358.29 | 240.86 | 180.81 | 136.46 | 126.19 | 203.39 | 130.41 | 464.06 | 279.28 | 290.25 |
| 1931 | 302.57 | 256.75 | 260.9 | 321.62 | 257.03 | 93.66 | 109.07 | 144.53 | 71.92 | 53.82 | 53.48 | 293.48 | 184.9 |
| 1932 | 462.42 | 500.92 | 307.64 | 282.94 | 241.2 | 199.02 | 183 | 210.65 | 112.81 | 179.05 | 235.78 | 582.23 | 291.47 |
| 1933 | 595.49 | 667.07 | 572.16 | 499.7 | 247.28 | 147.63 | 184.28 | 146.35 | 135.41 | 80.85 | 92.47 | 98.46 | 288.93 |
| 1934 | 151.95 | 157.18 | 530.49 | 249.8 | 232.28 | 300.26 | 191.56 | 195.83 | 121.93 | 240.1 | 110.6 | 141.23 | 218.6 |
| 1935 | 166.32 | 200.84 | 473.25 | 317.09 | 213.5 | 113.15 | 159.83 | 159.65 | 141.78 | 62.15 | 141.09 | 125.34 | 189.5 |
| 1936 | 1187.93 | 1027.32 | 449.14 | 1095.58 | 239.76 | 123.41 | 155.96 | 287.87 | 105.77 | 328.6 | 123.89 | 356.79 | 456.84 |
| 1937 | 737.06 | 600.72 | 502.49 | 568.61 | 466.5 | 181.51 | 178.08 | 195.18 | 193.93 | 190.57 | 208.41 | 197.06 | 351.68 |
| 1938 | 207.17 | 163.21 | 299.42 | 930.18 | 212.74 | 186.07 | 314.49 | 201.49 | 123.4 | 81.63 | 92.59 | 113.07 | 243.79 |
| 1939 | 186.15 | 538.22 | 704.07 | 444.22 | 259.58 | 284.36 | 181.37 | 408.99 | 177.48 | 109.06 | 98.75 | 126.54 | 293.23 |
| 1940 | 290.66 | 486.17 | 395.26 | 339.06 | 177.5 | 169.94 | 504.83 | 191.54 | 122.22 | 71.87 | 114.11 | 195.05 | 254.85 |
| 1941 | 235.77 | 194.68 | 280.09 | 209.52 | 111.36 | 70.64 | 206.34 | 155.31 | 90.04 | 68.8 | 55.02 | 308.42 | 165.5 |
| 1942 | 281.9 | 427.94 | 774.61 | 318.18 | 177.66 | 261.77 | 202.7 | 239.47 | 163.48 | 147.65 | 141.4 | 290.19 | 285.58 |
| 1943 | 828.04 | 419.4 | 1134.14 | 462.42 | 357.95 | 210.69 | 260.14 | 220.45 | 116.68 | 102.06 | 143.04 | 155.56 | 367.55 |
| 1944 | 323.46 | 407.73 | 968.44 | 1167.42 | 457.72 | 233.2 | 199.31 | 202.53 | 190.76 | 123.47 | 117.47 | 187.2 | 381.56 |
| 1945 | 224.35 | 521.61 | 360.48 | 409.33 | 370.55 | 156.39 | 206.46 | 185.77 | 183.87 | 152.94 | 197.71 | 478.45 | 287.33 |
| 1946 | 862.57 | 653.31 | 698.06 | 546.99 | 519.72 | 351.31 | 264.83 | 302.71 | 162.42 | 137.5 | 150.16 | 135.79 | 398.78 |
| 1947 | 621.91 | 310.19 | 616.77 | 616.08 | 365.62 | 295.88 | 227.92 | 176.09 | 112.57 | 96.62 | 342.8 | 466.68 | 354.09 |
| 1948 | 309.48 | 700.99 | 863.12 | 589.98 | 216.21 | 198.47 | 677.17 | 410.23 | 238.47 | 196.06 | 671.46 | 962.41 | 502.84 |
| 1949 | 609.36 | 808.25 | 505.23 | 515.46 | 579.22 | 317.74 | 482.25 | 315.43 | 292.8 | 192.56 | 189.41 | 230.25 | 419.83 |
| 1950 | 257.14 | 301.52 | 458.44 | 303.82 | 221.21 | 245.59 | 184.49 | 159.44 | 205.4 | 113.4 | 113.79 | 181.41 | 228.8 |
| 1951 | 202.08 | 198.84 | 271.1 | 409.37 | 176.61 | 132.25 | 130.53 | 94.44 | 96.64 | 74.12 | 160.19 | 377.89 | 193.67 |
| 1952 | 297.24 | 423.06 | 996.85 | 391.01 | 279.67 | 201.43 | 92.08 | 123.44 | 118.51 | 76.26 | 85.51 | 175.58 | 271.72 |
| 1953 | 461.86 | 522.51 | 442.93 | 439.2 | 763.99 | 196.37 | 312.28 | 145.03 | 171.21 | 150.86 | 116.24 | 674.13 | 366.38 |
| 1954 | 429.45 | 301.45 | 358.95 | 279.1 | 182.68 | 126.24 | 106.55 | 72.08 | 45.23 | 38.83 | 57.61 | 99.63 | 174.82 |
| 1955 | 209.55 | 333.48 | 192.74 | 348.34 | 181.06 | 101.15 | 195.32 | 130.13 | 64.94 | 56.11 | 74.3 | 99.46 | 165.55 |
| 1956 | 82.77 | 310.82 | 435.31 | 344.18 | 171.88 | 100.41 | 116.89 | 62.99 | 189.18 | 118.88 | 90.37 | 317.05 | 195.06 |
| 1957 | 257.26 | 250.22 | 344.72 | 646.55 | 334.22 | 164.92 | 127.25 | 84.51 | 102.7 | 156.76 | 297.06 | 292.22 | 254.87 |
| 1958 | 243.59 | 427.04 | 655.22 | 504.14 | 204.13 | 156.74 | 276.69 | 195.26 | 174.34 | 142 | 113.6 | 152.86 | 270.47 |
| 1959 | 257.95 | 530.67 | 558.26 | 334.27 | 220.05 | 455.85 | 199.23 | 158.52 | 158.37 | 225.07 | 187.36 | 220.35 | 292.16 |
| 1960 | 405.55 | 678.83 | 533.64 | 837.33 | 248.47 | 177.67 | 168.3 | 199.91 | 176.99 | -9999 | -9999 | -9999 | -9999 |
| |
|
|
|
|
|
|
|
|
|
|
|
|
|
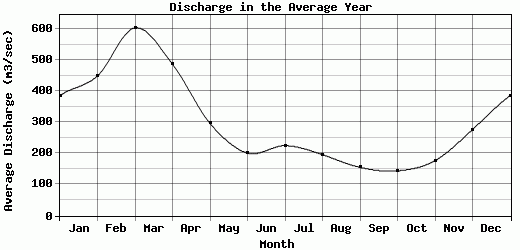
| Avg | 385.78 | 449.26 | 603.84 | 486.82 | 296.53 | 201.25 | 225.14 | 196.15 | 155.37 | 144.09 | 176.8 | 276.9 | 298.14 |
| |
|
|
|
|
|
|
|
|
|
|
|
|
|
| Std Dev | 241.04 |
200.49 |
456.5 |
229.17 |
144.59 |
84.41 |
120.63 |
84.89 |
61.12 |
96.09 |
135.73 |
187.53 |
102.06 |
| |
|
|
|
|
|
|
|
|
|
|
|
|
|
| | Jan | Feb | Mar | Apr | May | Jun | Jul | Aug | Sep | Oct | Nov | Dec | Avg Annual |
Click here for this table in tab-delimited format.
Tab-delimited format will open in most table browsing software, i.e. Excel, etc.
View this station on the map.
Return to start.