Results
| Country: | U.S.A.
| | Station: | ANDREWS L&D NR COLUMBIA, ALA. | | River: | CHATTAHOOCHEE R | | Area: | 21262.64 | | Lat: | 31.26 | | Lon: | -85.11 | | Source: | USGS | | PointID: | 2343801 | | Area Units: | km2 | | Discharge Units: | m3/sec | | Starting Year: | 1975 | | Ending Year: | 1993 | | Total Years: | 19 | | Total Usable Years: | 18 | |
| |
| Year | Jan | Feb | Mar | Apr | May | Jun | Jul | Aug | Sep | Oct | Nov | Dec | Avg Annual |
|---|
| 1975 | -9999 | -9999 | -9999 | -9999 | -9999 | -9999 | -9999 | -9999 | -9999 | 473.67 | 379.91 | 369.97 | -9999 |
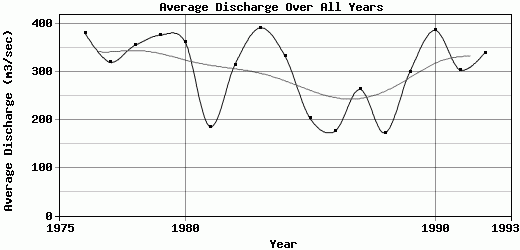
| 1976 | 502.37 | 452.67 | 610.95 | 434.45 | 447.27 | 384.94 | 287.8 | 210.19 | 190.84 | 181.29 | 293.68 | 561.82 | 379.86 |
| 1977 | 454.93 | 251.95 | 675.31 | 559.95 | 241.86 | 182.93 | 150.38 | 191.35 | 178.43 | 166.35 | 459.06 | 318.05 | 319.21 |
| 1978 | 896.93 | 505.51 | 599.92 | 308.63 | 520.69 | 250.57 | 172.37 | 333.18 | 217.45 | 169.4 | 128.94 | 150.39 | 354.5 |
| 1979 | 346.69 | 652.84 | 582.81 | 945.77 | 353.14 | 232.43 | 183.26 | 206.92 | 213.62 | 223.79 | 318.57 | 248.51 | 375.7 |
| 1980 | 345.61 | 396.82 | 993.29 | 780.42 | 565.05 | 249.31 | 212.93 | 211.39 | 171.42 | 142.56 | 142.27 | 135.2 | 362.19 |
| 1981 | 133.83 | 450.56 | 204.65 | 376.69 | 139.29 | 148.53 | 156.12 | 177.53 | 142.92 | 95.47 | 84.91 | 114.18 | 185.39 |
| 1982 | 409.74 | 731.42 | 295.19 | 398.33 | 232.88 | 179.85 | 182.94 | 253.87 | 168.26 | 154.35 | 168.63 | 599.7 | 314.6 |
| 1983 | 449.23 | 568.83 | 750.35 | 750.19 | 259.45 | 243.66 | 212.19 | 193.17 | 180.74 | 187.62 | 208.68 | 686.64 | 390.9 |
| 1984 | 535.92 | 457.33 | 602.96 | 415.65 | 436.15 | 199.92 | 213.26 | 411.95 | 216.35 | 144.62 | 147.94 | 207.11 | 332.43 |
| 1985 | 173.73 | 425.98 | 274.2 | 208.45 | 128.67 | 128.98 | 133.25 | 232.52 | 209.83 | 170.8 | 104.58 | 242.75 | 202.81 |
| 1986 | 201.85 | 283.51 | 370.94 | 152.46 | 136.63 | 111.94 | 133.32 | 65.33 | 64.15 | 67.53 | 216.57 | 301.24 | 175.46 |
| 1987 | 464.3 | 444.58 | 548.21 | 288.89 | 163.67 | 276.13 | 271.53 | 155.51 | 162.3 | 152.92 | 86.92 | 140.61 | 262.96 |
| 1988 | 269.42 | 311.61 | 218.54 | 205.09 | 185.45 | 130.1 | 68.66 | 57.91 | 121.94 | 161.93 | 178.68 | 157.59 | 172.24 |
| 1989 | 162.75 | 137.5 | 244.08 | 430.02 | 198.48 | 334.24 | 433.51 | 240.54 | 226.14 | 312 | 326.7 | 552.35 | 299.86 |
| 1990 | 729.98 | 841.42 | 1299.75 | 391.37 | 249.5 | 252.97 | 145.76 | 152.23 | 129.29 | 130.62 | 161.75 | 145.24 | 385.82 |
| 1991 | 227.73 | 344.17 | 484.69 | 265.1 | 533.66 | 316.9 | 281.54 | 253.44 | 292.63 | 228.74 | 152.5 | 255.6 | 303.06 |
| 1992 | 367.54 | 500.08 | 452.35 | 246 | 195.65 | 149.13 | 192.55 | 179.9 | 236.79 | 194.21 | 659.45 | 698.33 | 339.33 |
| 1993 | 642.45 | 460.32 | 662.44 | 450.24 | 303.55 | 174.49 | 162.33 | 188.62 | 144.85 | -9999 | -9999 | -9999 | -9999 |
| |
|
|
|
|
|
|
|
|
|
|
|
|
|
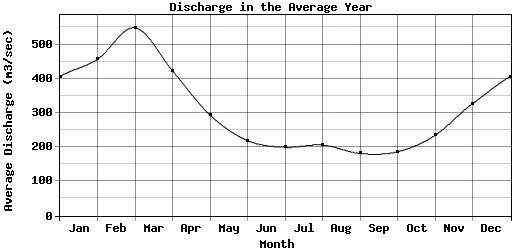
| Avg | 406.39 | 456.51 | 548.37 | 422.65 | 293.95 | 219.28 | 199.65 | 206.42 | 181.55 | 186.55 | 234.43 | 326.96 | 303.31 |
| |
|
|
|
|
|
|
|
|
|
|
|
|
|
| Std Dev | 200.51 |
165.17 |
273.53 |
208.91 |
141.97 |
74.54 |
78.45 |
79.72 |
50.2 |
86.42 |
145.27 |
196.16 |
74.11 |
| |
|
|
|
|
|
|
|
|
|
|
|
|
|
| | Jan | Feb | Mar | Apr | May | Jun | Jul | Aug | Sep | Oct | Nov | Dec | Avg Annual |
Click here for this table in tab-delimited format.
Tab-delimited format will open in most table browsing software, i.e. Excel, etc.
View this station on the map.
Return to start.