Results
| Country: | U.S.A.
| | Station: | ALAGA, ALA | | River: | CHATTAHOOCHEE RIVER | | Area: | 21599.32 | | Lat: | 31.11 | | Lon: | -85.04 | | Source: | USGS | | PointID: | 2344000 | | Area Units: | km2 | | Discharge Units: | m3/sec | | Starting Year: | 1938 | | Ending Year: | 1970 | | Total Years: | 33 | | Total Usable Years: | 18 | |
| |
| Year | Jan | Feb | Mar | Apr | May | Jun | Jul | Aug | Sep | Oct | Nov | Dec | Avg Annual |
|---|
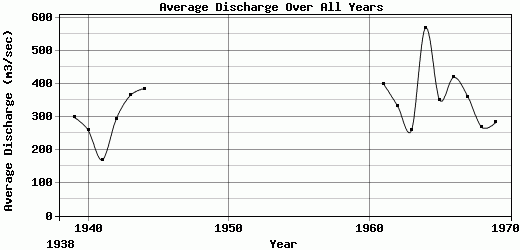
| 1938 | -9999 | -9999 | -9999 | -9999 | 225.91 | 194.63 | 319.85 | 202.97 | 132.73 | 94.05 | 99.86 | 117.86 | -9999 |
| 1939 | 188.77 | 538.86 | 691.76 | 448.4 | 265 | 285.95 | 186.07 | 419.16 | 188.47 | 121.05 | 106.19 | 135.37 | 297.92 |
| 1940 | 296.76 | 492.98 | 393.62 | 336.74 | 191.3 | 167.81 | 510.73 | 193.36 | 127.04 | 78.01 | 122.16 | 194.76 | 258.77 |
| 1941 | 234.58 | 199.83 | 284.47 | 216.88 | 120.07 | 78.29 | 208.22 | 158.36 | 93.65 | 68.75 | 58.52 | 302.21 | 168.65 |
| 1942 | 302.06 | 442.89 | 765.29 | 340.15 | 193.09 | 270.18 | 204.18 | 237.46 | 166.55 | 155.82 | 148 | 285.9 | 292.63 |
| 1943 | 798.81 | 422.33 | 1080.52 | 464.68 | 360.26 | 216.85 | 268.76 | 226.65 | 120.49 | 105.5 | 144.07 | 156.38 | 363.77 |
| 1944 | 323.67 | 411.48 | 952.55 | 1151.65 | 474.54 | 245.93 | 200.35 | 209.37 | 196.3 | 130.58 | 123.73 | 194.4 | 384.55 |
| 1945 | -9999 | -9999 | -9999 | -9999 | -9999 | -9999 | -9999 | -9999 | -9999 | -9999 | -9999 | -9999 | -9999 |
| 1946 | -9999 | -9999 | -9999 | -9999 | -9999 | -9999 | -9999 | -9999 | -9999 | -9999 | -9999 | -9999 | -9999 |
| 1947 | -9999 | -9999 | -9999 | -9999 | -9999 | -9999 | -9999 | -9999 | -9999 | -9999 | -9999 | -9999 | -9999 |
| 1948 | -9999 | -9999 | -9999 | -9999 | -9999 | -9999 | -9999 | -9999 | -9999 | -9999 | -9999 | -9999 | -9999 |
| 1949 | -9999 | -9999 | -9999 | -9999 | -9999 | -9999 | -9999 | -9999 | -9999 | -9999 | -9999 | -9999 | -9999 |
| 1950 | -9999 | -9999 | -9999 | -9999 | -9999 | -9999 | -9999 | -9999 | -9999 | -9999 | -9999 | -9999 | -9999 |
| 1951 | -9999 | -9999 | -9999 | -9999 | -9999 | -9999 | -9999 | -9999 | -9999 | -9999 | -9999 | -9999 | -9999 |
| 1952 | -9999 | -9999 | -9999 | -9999 | -9999 | -9999 | -9999 | -9999 | -9999 | -9999 | -9999 | -9999 | -9999 |
| 1953 | -9999 | -9999 | -9999 | -9999 | -9999 | -9999 | -9999 | -9999 | -9999 | -9999 | -9999 | -9999 | -9999 |
| 1954 | -9999 | -9999 | -9999 | -9999 | -9999 | -9999 | -9999 | -9999 | -9999 | -9999 | -9999 | -9999 | -9999 |
| 1955 | -9999 | -9999 | -9999 | -9999 | -9999 | -9999 | -9999 | -9999 | -9999 | -9999 | -9999 | -9999 | -9999 |
| 1956 | -9999 | -9999 | -9999 | -9999 | -9999 | -9999 | -9999 | -9999 | -9999 | -9999 | -9999 | -9999 | -9999 |
| 1957 | -9999 | -9999 | -9999 | -9999 | -9999 | -9999 | -9999 | -9999 | -9999 | -9999 | -9999 | -9999 | -9999 |
| 1958 | -9999 | -9999 | -9999 | -9999 | -9999 | -9999 | -9999 | -9999 | -9999 | -9999 | -9999 | -9999 | -9999 |
| 1959 | -9999 | -9999 | -9999 | -9999 | -9999 | -9999 | -9999 | -9999 | -9999 | -9999 | -9999 | -9999 | -9999 |
| 1960 | -9999 | -9999 | -9999 | -9999 | -9999 | -9999 | -9999 | -9999 | -9999 | 198.43 | 167.69 | 196.38 | -9999 |
| 1961 | 201.53 | 754.99 | 715.96 | 933.33 | 388.74 | 273.11 | 304.72 | 231.73 | 172.65 | 112.49 | 141.04 | 562.31 | 399.38 |
| 1962 | 553.28 | 573.63 | 664.72 | 845.17 | 243.96 | 187.26 | 157.62 | 124.49 | 122.06 | 108.86 | 211.31 | 191.58 | 331.99 |
| 1963 | 436.28 | 418.96 | 278.53 | 309.39 | 337.22 | 256.62 | 206.7 | 161.48 | 151.98 | 101.86 | 147.48 | 301.71 | 259.02 |
| 1964 | 646.79 | 633.1 | 893.17 | 1202.42 | 744.21 | 227.15 | 335.43 | 363.24 | 230.36 | 562.82 | 339.93 | 640.45 | 568.26 |
| 1965 | 499.98 | 702.23 | 706.46 | 536.64 | 231.09 | 304.48 | 184.07 | 149.33 | 176.4 | 244.02 | 205.31 | 253.12 | 349.43 |
| 1966 | 529 | 849.05 | 962.81 | 326.81 | 444.01 | 298.89 | 215.25 | 284.29 | 198.73 | 206.25 | 391.08 | 318.68 | 418.74 |
| 1967 | 642.1 | 479.95 | 346.52 | 206.77 | 202.39 | 274.56 | 356.33 | 292.47 | 350.81 | 245.96 | 322.33 | 601.84 | 360.17 |
| 1968 | 573.41 | 285.03 | 509.32 | 344.78 | 244.36 | 196.46 | 149.46 | 189.09 | 158.37 | 129.97 | 189.71 | 234.11 | 267.01 |
| 1969 | 299.43 | 327.11 | 399.87 | 515.34 | 359.3 | 226.06 | 185.6 | 189.4 | 217.51 | 206 | 211.05 | 253.54 | 282.52 |
| 1970 | 285.5 | 342.9 | 586.73 | 362.16 | 168.6 | 236.12 | 197.09 | 285.12 | 266.55 | -9999 | -9999 | -9999 | -9999 |
| |
|
|
|
|
|
|
|
|
|
|
|
|
|
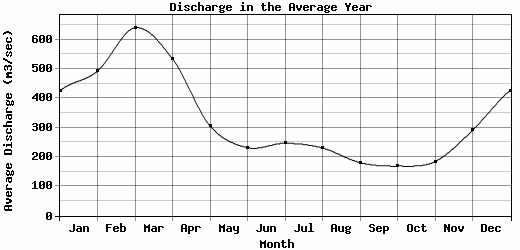
| Avg | 425.75 | 492.21 | 639.52 | 533.83 | 305.53 | 231.79 | 246.5 | 230.47 | 180.63 | 168.85 | 184.09 | 290.62 | 333.52 |
| |
|
|
|
|
|
|
|
|
|
|
|
|
|
| Std Dev | 178.56 |
170.75 |
246.31 |
310.23 |
146.43 |
54.83 |
90.1 |
75.45 |
60.48 |
112.47 |
87.77 |
155.15 |
89.25 |
| |
|
|
|
|
|
|
|
|
|
|
|
|
|
| | Jan | Feb | Mar | Apr | May | Jun | Jul | Aug | Sep | Oct | Nov | Dec | Avg Annual |
Click here for this table in tab-delimited format.
Tab-delimited format will open in most table browsing software, i.e. Excel, etc.
View this station on the map.
Return to start.