Results
| Country: | U.S.A.
| | Station: | LEESBURG AL | | River: | COOSA RIVER | | Area: | 13648.49 | | Lat: | 34.17 | | Lon: | -85.75 | | Source: | USGS | | PointID: | 2399500 | | Area Units: | km2 | | Discharge Units: | m3/sec | | Starting Year: | 1937 | | Ending Year: | 1958 | | Total Years: | 22 | | Total Usable Years: | 21 | |
| |
| Year | Jan | Feb | Mar | Apr | May | Jun | Jul | Aug | Sep | Oct | Nov | Dec | Avg Annual |
|---|
| 1937 | -9999 | -9999 | -9999 | -9999 | -9999 | -9999 | -9999 | -9999 | -9999 | 116.78 | 74.95 | 96.33 | -9999 |
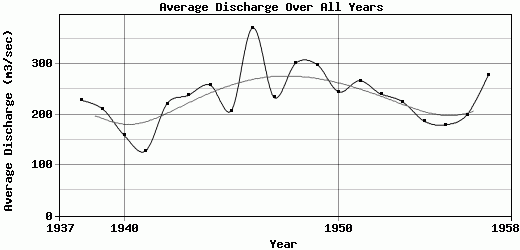
| 1938 | 158.65 | 122.41 | 440.93 | 840.03 | 163.14 | 224.97 | 333.23 | 155.6 | 70.86 | 46.76 | 99.66 | 79.18 | 227.95 |
| 1939 | 232.46 | 656.45 | 572.54 | 291.84 | 196.06 | 151.61 | 99.9 | 116.61 | 65.48 | 45.45 | 44.47 | 56.51 | 210.78 |
| 1940 | 123.63 | 330.54 | 342.12 | 253.88 | 110.63 | 104.67 | 195.33 | 124.05 | 67.81 | 42.08 | 69.29 | 137.89 | 158.49 |
| 1941 | 192.25 | 121.05 | 196.11 | 148.14 | 73.6 | 68.07 | 299.93 | 114.39 | 46.78 | 41.16 | 62.32 | 173.04 | 128.07 |
| 1942 | 156.64 | 455.17 | 554.89 | 187.18 | 148.1 | 130.34 | 98.11 | 211.21 | 129.69 | 96.87 | 84.57 | 404.07 | 221.4 |
| 1943 | 556.79 | 402.22 | 594.97 | 427.58 | 180.32 | 111.79 | 150.01 | 118.52 | 94.25 | 59.73 | 67.79 | 93.86 | 238.15 |
| 1944 | 207.14 | 648.64 | 850.83 | 642.42 | 235.53 | 116.69 | 84.89 | 70.88 | 53.5 | 50.6 | 51.39 | 88.34 | 258.4 |
| 1945 | 218.59 | 516.16 | 340.89 | 287.7 | 247.08 | 113.53 | 103.1 | 98.39 | 79.73 | 66.96 | 101.47 | 318.77 | 207.7 |
| 1946 | 896.39 | 1019.31 | 533.64 | 544.99 | 506.31 | 264.48 | 159.6 | 82.9 | 81.19 | 77.48 | 144.78 | 144.87 | 371.33 |
| 1947 | 979.11 | 259.95 | 375.06 | 370.8 | 165.99 | 130.73 | 81.06 | 66.91 | 49.64 | 53.47 | 124.25 | 147.58 | 233.71 |
| 1948 | 148.23 | 789.22 | 454.84 | 385.96 | 135.48 | 94.12 | 136.58 | 165.99 | 65.65 | 51.64 | 483.49 | 706.95 | 301.51 |
| 1949 | 693.59 | 699.83 | 313.22 | 365.87 | 309.19 | 190.87 | 226.18 | 124.7 | 151.04 | 131.06 | 196.14 | 183.8 | 298.79 |
| 1950 | 345.03 | 354 | 561.5 | 203.92 | 110.74 | 181.65 | 201.05 | 149.53 | 434.89 | 119.43 | 124.45 | 152.72 | 244.91 |
| 1951 | 195.54 | 281.77 | 465.17 | 768.79 | 164.5 | 126.01 | 134.57 | 90.8 | 87.53 | 79.29 | 195.5 | 612.3 | 266.81 |
| 1952 | 447.34 | 357.3 | 769.72 | 318.21 | 171.89 | 148.23 | 84.68 | 117.01 | 101.36 | 78.48 | 94.09 | 192.35 | 240.06 |
| 1953 | 477.2 | 546.22 | 392.09 | 193.16 | 350.02 | 116.05 | 144.55 | 77.48 | 74.54 | 67.8 | 71.9 | 187.74 | 224.9 |
| 1954 | 650.8 | 245.43 | 319.04 | 297.41 | 185.24 | 133.81 | 71.51 | 64.77 | 56.47 | 59.75 | 58.54 | 99.23 | 186.83 |
| 1955 | 179.47 | 428.52 | 314.81 | 404.02 | 216.27 | 111.85 | 108.42 | 86.23 | 50.35 | 63.45 | 90.97 | 102.16 | 179.71 |
| 1956 | 72.45 | 570.17 | 408.61 | 494.04 | 211.32 | 97.53 | 104.5 | 66.05 | 67.56 | 73.49 | 71.68 | 159.11 | 199.71 |
| 1957 | 235.99 | 667.71 | 301.23 | 534.76 | 174.96 | 138.27 | 94.1 | 61.17 | 103.83 | 171.64 | 459.08 | 400.52 | 278.6 |
| 1958 | 238.04 | 300.46 | 360.61 | 361.09 | 330.39 | 116.78 | 213.81 | 108.03 | 99.74 | -9999 | -9999 | -9999 | -9999 |
| |
|
|
|
|
|
|
|
|
|
|
|
|
|
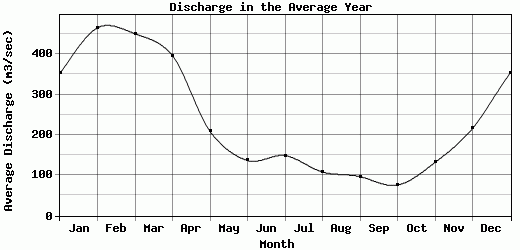
| Avg | 352.63 | 465.36 | 450.61 | 396.28 | 208.89 | 136.76 | 148.81 | 108.15 | 96.76 | 75.87 | 131.94 | 216.06 | 233.89 |
| |
|
|
|
|
|
|
|
|
|
|
|
|
|
| Std Dev | 255.32 |
221.81 |
156.24 |
181.72 |
95.64 |
44.57 |
70.66 |
37.9 |
79.95 |
33.04 |
117.37 |
172.06 |
53.02 |
| |
|
|
|
|
|
|
|
|
|
|
|
|
|
| | Jan | Feb | Mar | Apr | May | Jun | Jul | Aug | Sep | Oct | Nov | Dec | Avg Annual |
Click here for this table in tab-delimited format.
Tab-delimited format will open in most table browsing software, i.e. Excel, etc.
View this station on the map.
Return to start.