Results
| Country: | U.S.A.
| | Station: | RIVERSIDE AL | | River: | COOSA RIVER | | Area: | 18307.62 | | Lat: | 33.6 | | Lon: | -86.19 | | Source: | USGS | | PointID: | 2402500 | | Area Units: | km2 | | Discharge Units: | m3/sec | | Starting Year: | 1896 | | Ending Year: | 1916 | | Total Years: | 21 | | Total Usable Years: | 20 | |
| |
| Year | Jan | Feb | Mar | Apr | May | Jun | Jul | Aug | Sep | Oct | Nov | Dec | Avg Annual |
|---|
| 1896 | -9999 | -9999 | -9999 | -9999 | -9999 | -9999 | -9999 | -9999 | -9999 | 62.85 | 131.33 | 116.82 | -9999 |
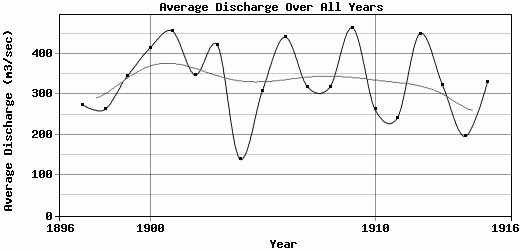
| 1897 | 238.88 | 528.23 | 1053.67 | 501.19 | 199.4 | 110.88 | 202.27 | 109.61 | 55.93 | 51.52 | 50.61 | 185.97 | 274.01 |
| 1898 | 327.86 | 163.28 | 165.72 | 513.44 | 132.67 | 92.93 | 121.46 | 247.98 | 394.49 | 543.06 | 237.18 | 208.89 | 262.41 |
| 1899 | 307.49 | 877.22 | 1078.88 | 705.38 | 219.26 | 135.11 | 150.55 | 107.76 | 100.69 | 71.09 | 87.45 | 301.12 | 345.17 |
| 1900 | 377.97 | 665.1 | 759.54 | 844.32 | 232.27 | 629.29 | 385.76 | 145.8 | 183.55 | 195.71 | 217.25 | 333.44 | 414.17 |
| 1901 | 738.95 | 616.88 | 583.8 | 866.97 | 458.63 | 349.49 | 185.05 | 576.9 | 282.63 | 161.24 | 113.73 | 534.91 | 455.76 |
| 1902 | 674.46 | 703.58 | 984.52 | 591.43 | 180.53 | 120.32 | 105.28 | 101.31 | 111.55 | 127.02 | 113.14 | 360.31 | 347.79 |
| 1903 | 341.61 | 1222.38 | 1157.43 | 820.91 | 319.64 | 443.26 | 226.35 | 167.34 | 90.93 | 82.75 | 94.4 | 84.46 | 420.96 |
| 1904 | 148.11 | 237.66 | 322.33 | 211.31 | 104.13 | 101.96 | 93.88 | 173.22 | 56.34 | 38.34 | 48.51 | 145.28 | 140.09 |
| 1905 | 410.62 | 859.47 | 331.46 | 205.8 | 414.93 | 177.23 | 226.42 | 192.87 | 90.76 | 111.07 | 80.4 | 604.18 | 308.77 |
| 1906 | 639.14 | 241.45 | 973.25 | 419.16 | 194.07 | 285.01 | 499.18 | 316.77 | 298.13 | 577.91 | 500.3 | 347.48 | 440.99 |
| 1907 | 444.32 | 554.59 | 556.67 | 299.22 | 451.57 | 305.63 | 169.44 | 150.01 | 181.25 | 115.83 | 266.76 | 326.93 | 318.52 |
| 1908 | 508.85 | 839.35 | 574.98 | 450.45 | 292.61 | 168.83 | 139.65 | 139.44 | 103.33 | 79.39 | 77.98 | 440.01 | 317.91 |
| 1909 | 425.82 | 870.98 | 1275.91 | 537.04 | 588.35 | 704.53 | 297.05 | 330.53 | 131.72 | 118.15 | 82.12 | 207.34 | 464.13 |
| 1910 | 233.23 | 351.31 | 327.57 | 170.41 | 519.48 | 353.24 | 570.92 | 181.47 | 142.14 | 90.05 | 68.33 | 147.21 | 262.95 |
| 1911 | 377.44 | 310.88 | 204.49 | 689.51 | 175.62 | 99.69 | 173.11 | 180.78 | 65.02 | 113.69 | 158.56 | 356.18 | 242.08 |
| 1912 | 464.64 | 805.39 | 1085.91 | 972.88 | 463.92 | 361.53 | 384.02 | 239.38 | 147.97 | 156.65 | 104.9 | 209.56 | 449.73 |
| 1913 | 534.1 | 780.44 | 1129.85 | 374.52 | 205.56 | 179.44 | 124.46 | 129.21 | 79.99 | 117.97 | 64.36 | 163.11 | 323.58 |
| 1914 | 150.4 | 283.72 | 165.2 | 535.68 | 132.45 | 81.7 | 133.48 | 122.43 | 71 | 117.45 | 81.02 | 476.49 | 195.92 |
| 1915 | 626.72 | 715.41 | 374.15 | 169.66 | 310.06 | 138.8 | 214.68 | 128.05 | 157.66 | 405.63 | 174.2 | 539.41 | 329.54 |
| 1916 | 739.53 | 509.14 | 337.12 | 209.19 | 216.86 | 237.98 | 1301.18 | 295.99 | 131.84 | -9999 | -9999 | -9999 | -9999 |
| |
|
|
|
|
|
|
|
|
|
|
|
|
|
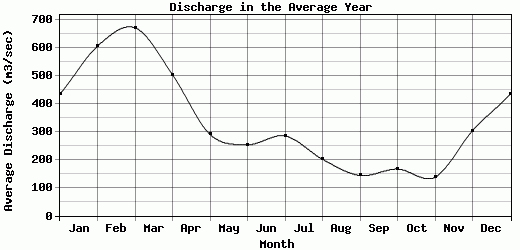
| Avg | 435.51 | 606.82 | 672.12 | 504.42 | 290.6 | 253.84 | 285.21 | 201.84 | 143.85 | 166.87 | 137.63 | 304.46 | 332.34 |
| |
|
|
|
|
|
|
|
|
|
|
|
|
|
| Std Dev | 176.54 |
271.68 |
374.74 |
245.56 |
139.78 |
173.36 |
266.31 |
109.54 |
86.75 |
151.04 |
102.88 |
150.06 |
89.15 |
| |
|
|
|
|
|
|
|
|
|
|
|
|
|
| | Jan | Feb | Mar | Apr | May | Jun | Jul | Aug | Sep | Oct | Nov | Dec | Avg Annual |
Click here for this table in tab-delimited format.
Tab-delimited format will open in most table browsing software, i.e. Excel, etc.
View this station on the map.
Return to start.