Results
| Country: | U.S.A.
| | Station: | CROPWELL AL | | River: | COOSA RIVER | | Area: | 19845.99 | | Lat: | 33.52 | | Lon: | -86.22 | | Source: | USGS | | PointID: | 2405000 | | Area Units: | km2 | | Discharge Units: | m3/sec | | Starting Year: | 1941 | | Ending Year: | 1958 | | Total Years: | 18 | | Total Usable Years: | 17 | |
| |
| Year | Jan | Feb | Mar | Apr | May | Jun | Jul | Aug | Sep | Oct | Nov | Dec | Avg Annual |
|---|
| 1941 | -9999 | -9999 | -9999 | -9999 | -9999 | -9999 | -9999 | -9999 | -9999 | 56.63 | 87.78 | 260.52 | -9999 |
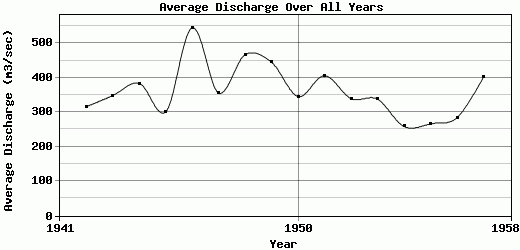
| 1942 | 215.21 | 622.97 | 829.69 | 276.82 | 204.58 | 179.86 | 144.37 | 262.39 | 176.27 | 136.33 | 110.39 | 633.8 | 316.06 |
| 1943 | 790.14 | 573.72 | 965.15 | 684.33 | 252.98 | 158.67 | 195.11 | 165.03 | 121.62 | 82.14 | 86.03 | 106.98 | 348.49 |
| 1944 | 272.12 | 907.36 | 1279.38 | 1076.71 | 334.41 | 164.9 | 115.71 | 101.59 | 84.67 | 78.05 | 69.24 | 116.26 | 383.37 |
| 1945 | 312 | 756.92 | 546.88 | 425.56 | 381.71 | 172.61 | 142.14 | 129.34 | 101.27 | 99.31 | 131.16 | 414.62 | 301.13 |
| 1946 | 1376.11 | 1584.84 | 780.45 | 775.32 | 650.01 | 377.21 | 220.32 | 113.51 | 129.19 | 111.35 | 201.04 | 215.42 | 544.56 |
| 1947 | 1412.84 | 417.62 | 660.24 | 611.84 | 251.16 | 183.05 | 117.06 | 96.54 | 69.41 | 68.64 | 159.37 | 216.9 | 355.39 |
| 1948 | 214.65 | 1227.1 | 708.38 | 646.1 | 175.27 | 136.95 | 198.65 | 250.62 | 91.97 | 71.76 | 828.58 | 1051.47 | 466.79 |
| 1949 | 1140.08 | 1158.67 | 508.43 | 557.66 | 461.97 | 240.18 | 291.97 | 159.39 | 187.29 | 148.66 | 249.57 | 229.29 | 444.43 |
| 1950 | 462.54 | 532.08 | 845.67 | 292.53 | 170.68 | 233.63 | 307.04 | 207.55 | 568.34 | 158.91 | 162.07 | 205.52 | 345.55 |
| 1951 | 286.48 | 453.33 | 754.66 | 1261.33 | 234.59 | 167.29 | 197.64 | 126.42 | 122.61 | 109.91 | 236.77 | 918.68 | 405.81 |
| 1952 | 667.37 | 550.72 | 1116.15 | 418.77 | 210.92 | 190.21 | 113.54 | 161.59 | 136.8 | 109.39 | 131.01 | 266.52 | 339.42 |
| 1953 | 807.4 | 799.61 | 587.26 | 301.52 | 527.97 | 162.36 | 184.68 | 117.27 | 102.39 | 85.77 | 98.96 | 278.76 | 337.83 |
| 1954 | 946.01 | 355.56 | 444.52 | 400.46 | 238.02 | 174.46 | 101.53 | 84.14 | 72.01 | 74.53 | 81.8 | 129.8 | 258.57 |
| 1955 | 287.85 | 676.67 | 493.74 | 651.95 | 286.2 | 149.92 | 134.66 | 106.69 | 72.66 | 82.88 | 122.89 | 129.28 | 266.28 |
| 1956 | 102.82 | 840.49 | 660.33 | 742.06 | 256.3 | 125.33 | 130.91 | 90.24 | 83.2 | 88.49 | 94.4 | 190.4 | 283.75 |
| 1957 | 291.66 | 916.76 | 490.8 | 813.13 | 234.68 | 209.13 | 137.95 | 83.02 | 127.37 | 264.18 | 636.06 | 612.74 | 401.46 |
| 1958 | 339.69 | 475.75 | 564.24 | 495.45 | 430.24 | 160.26 | 316.68 | 145.7 | 150.65 | -9999 | -9999 | -9999 | -9999 |
| |
|
|
|
|
|
|
|
|
|
|
|
|
|
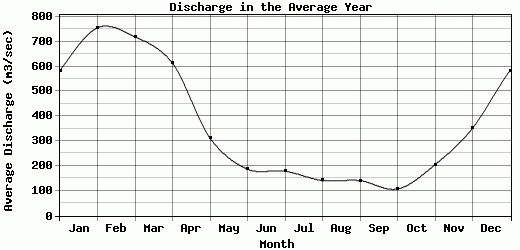
| Avg | 583.82 | 755.89 | 719.76 | 613.62 | 311.86 | 187.41 | 179.41 | 141.24 | 141.04 | 107.47 | 205.12 | 351.59 | 362.43 |
| |
|
|
|
|
|
|
|
|
|
|
|
|
|
| Std Dev | 410.55 |
318.39 |
225.72 |
262.76 |
130.96 |
55.73 |
67.52 |
53.19 |
112.12 |
48.03 |
201.93 |
276.2 |
74.34 |
| |
|
|
|
|
|
|
|
|
|
|
|
|
|
| | Jan | Feb | Mar | Apr | May | Jun | Jul | Aug | Sep | Oct | Nov | Dec | Avg Annual |
Click here for this table in tab-delimited format.
Tab-delimited format will open in most table browsing software, i.e. Excel, etc.
View this station on the map.
Return to start.