Results
| Country: | Mexico
| | Station: | Matamoros | | River: | Bravo | | Area: | 459902 km2 | | Lat: | 25.9 | | Lon: | -97.52 | | Source: | RivDIS | | PointID: | 1091 | | Area Units: | km2 | | Discharge Units: | m3/sec | | Starting Year: | 1976 | | Ending Year: | 1979 | | Total Years: | 4 | | Total Usable Years: | 4 | |
| |
| Year | Jan | Feb | Mar | Apr | May | Jun | Jul | Aug | Sep | Oct | Nov | Dec | Avg Annual |
|---|
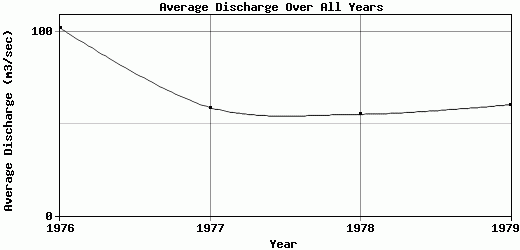
| 1976 | 4.6 | 6.9 | 4.9 | 8.9 | 19 | 3.8 | 183 | 374 | 187 | 170 | 69 | 197 | 102.34 |
| 1977 | 152 | 137 | 30 | 104 | 157 | 56 | 10.5 | 4.7 | 32.5 | 2.8 | 14 | 6.4 | 58.91 |
| 1978 | 10.5 | 6.6 | 2.4 | 6.5 | 6.9 | 10.5 | 2.5 | 3.3 | 58.5 | 277 | 128 | 150 | 55.23 |
| 1979 | 81 | 45.5 | 66.5 | 60.5 | 63.5 | 232 | 89.5 | 11.5 | 44.5 | 5.6 | 12 | 12.5 | 60.38 |
| |
|
|
|
|
|
|
|
|
|
|
|
|
|
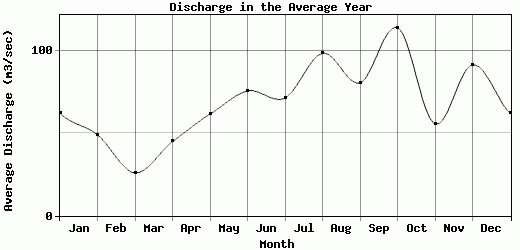
| Avg | 62.03 | 49 | 25.95 | 44.98 | 61.6 | 75.58 | 71.38 | 98.38 | 80.63 | 113.85 | 55.75 | 91.48 | 69.22 |
| |
|
|
|
|
|
|
|
|
|
|
|
|
|
| Std Dev | 60.02 |
53.21 |
25.78 |
40.33 |
58.97 |
92.52 |
72.87 |
159.16 |
62.1 |
116 |
47.57 |
83.72 |
19.22 |
| |
|
|
|
|
|
|
|
|
|
|
|
|
|
| | Jan | Feb | Mar | Apr | May | Jun | Jul | Aug | Sep | Oct | Nov | Dec | Avg Annual |
Click here for this table in tab-delimited format.
Tab-delimited format will open in most table browsing software, i.e. Excel, etc.
View this station on the map.
Return to start.