Results
| Country: | U.S.A.
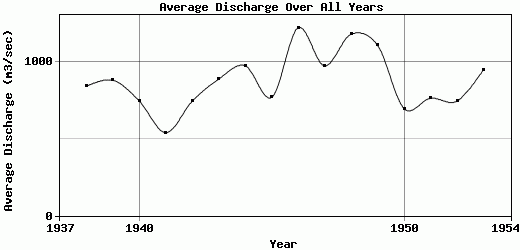
| | Station: | MILLERS FERRY AL | | River: | ALABAMA RIVER | | Area: | 53438.89 | | Lat: | 32.12 | | Lon: | -87.4 | | Source: | USGS | | PointID: | 2427500 | | Area Units: | km2 | | Discharge Units: | m3/sec | | Starting Year: | 1937 | | Ending Year: | 1954 | | Total Years: | 18 | | Total Usable Years: | 17 | |
| |
| Year | Jan | Feb | Mar | Apr | May | Jun | Jul | Aug | Sep | Oct | Nov | Dec | Avg Annual |
|---|
| 1937 | -9999 | -9999 | -9999 | -9999 | -9999 | -9999 | -9999 | -9999 | -9999 | 489.06 | 585.97 | 472.35 | -9999 |
| 1938 | 548.98 | 464.3 | 1339.67 | 3943.24 | 654.31 | 488.47 | 796.9 | 681.34 | 361.8 | 278.26 | 279.18 | 292.69 | 844.1 |
| 1939 | 523.13 | 1619.33 | 1924.37 | 1055.66 | 577.76 | 791.93 | 400.55 | 2145.79 | 522.07 | 386.76 | 311.88 | 342.45 | 883.47 |
| 1940 | 742.36 | 1570.62 | 1304.13 | 917.19 | 584.34 | 501.49 | 1569.22 | 431.97 | 297.07 | 258.93 | 285.44 | 513.36 | 748.01 |
| 1941 | 755.79 | 674.75 | 968.44 | 592.11 | 387.91 | 257.79 | 738.88 | 585.91 | 301.43 | 245.6 | 201.08 | 788.37 | 541.51 |
| 1942 | 670.38 | 1142.69 | 2032.34 | 963.16 | 433.25 | 679.7 | 452.43 | 621.97 | 395.12 | 357.74 | 322.69 | 880.48 | 746 |
| 1943 | 2011.24 | 1131.77 | 2572.01 | 1652.67 | 713.13 | 398.84 | 441.84 | 475.63 | 336.09 | 262.22 | 319.57 | 378.57 | 891.13 |
| 1944 | 775.15 | 1413.31 | 2327.84 | 3234.84 | 1433.48 | 469.78 | 351.4 | 429.6 | 327.18 | 270.55 | 296.88 | 405.02 | 977.92 |
| 1945 | 663.71 | 1596.17 | 1383.33 | 1317.97 | 1382.14 | 453.73 | 393.06 | 334.31 | 280.95 | 303.46 | 334.37 | 820.92 | 772.01 |
| 1946 | 2832.61 | 2608 | 2002.93 | 1700.81 | 1421.15 | 1087.56 | 695.05 | 558.67 | 487.86 | 339.01 | 474.01 | 490.89 | 1224.88 |
| 1947 | 2536.93 | 1288.02 | 1634.9 | 1858.54 | 966.71 | 602.77 | 483.03 | 342.54 | 300.52 | 247.87 | 581.1 | 887.88 | 977.57 |
| 1948 | 630.83 | 2387.51 | 2195.02 | 1697.98 | 504.86 | 375.08 | 525.27 | 664.44 | 312.82 | 307.46 | 1438.81 | 3161.09 | 1183.43 |
| 1949 | 2261.25 | 2685.77 | 1525.56 | 1484 | 1560.72 | 720.76 | 906.24 | 513.73 | 492.43 | 315.15 | 438.44 | 434.25 | 1111.52 |
| 1950 | 726.92 | 1016.78 | 1409.36 | 733.69 | 662.89 | 468.84 | 644.65 | 642.07 | 863.2 | 389.53 | 362.53 | 459.28 | 698.31 |
| 1951 | 639.69 | 894.72 | 1168.94 | 2626.4 | 624.89 | 360.33 | 392.24 | 305.15 | 270.15 | 236.04 | 383.04 | 1283.16 | 765.4 |
| 1952 | 1162.73 | 1199.96 | 2455.08 | 1159.77 | 610.19 | 474.4 | 276.2 | 336.16 | 277.25 | 243.43 | 248.29 | 523.3 | 747.23 |
| 1953 | 1588.49 | 1632.17 | 1670.79 | 1299.18 | 1891.12 | 488.47 | 448.09 | 321.29 | 309.88 | 311.57 | 276.24 | 1173.18 | 950.87 |
| 1954 | 1306.33 | 877.73 | 927.88 | 890.48 | 459.46 | 339.6 | 231.82 | 223.02 | 184.32 | -9999 | -9999 | -9999 | -9999 |
| |
|
|
|
|
|
|
|
|
|
|
|
|
|
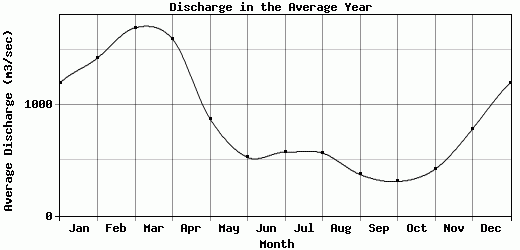
| Avg | 1198.62 | 1423.74 | 1696.62 | 1595.75 | 874.61 | 527.03 | 573.35 | 565.51 | 371.77 | 308.39 | 419.97 | 782.78 | 878.96 |
| |
|
|
|
|
|
|
|
|
|
|
|
|
|
| Std Dev | 739.63 |
619.06 |
493.63 |
878.54 |
456.71 |
194.68 |
307.48 |
418.51 |
149.82 |
65.44 |
275.38 |
658.39 |
179.5 |
| |
|
|
|
|
|
|
|
|
|
|
|
|
|
| | Jan | Feb | Mar | Apr | May | Jun | Jul | Aug | Sep | Oct | Nov | Dec | Avg Annual |
Click here for this table in tab-delimited format.
Tab-delimited format will open in most table browsing software, i.e. Excel, etc.
View this station on the map.
Return to start.