Results
| Country: | U.S.A.
| | Station: | CLAIBORNE L&D NEAR MONROEVILLE | | River: | ALABAMA RIVER | | Area: | 55611.77 | | Lat: | 31.61 | | Lon: | -87.55 | | Source: | USGS | | PointID: | 2428400 | | Area Units: | km2 | | Discharge Units: | m3/sec | | Starting Year: | 1975 | | Ending Year: | 1993 | | Total Years: | 19 | | Total Usable Years: | 18 | |
| |
| Year | Jan | Feb | Mar | Apr | May | Jun | Jul | Aug | Sep | Oct | Nov | Dec | Avg Annual |
|---|
| 1975 | -9999 | -9999 | -9999 | -9999 | -9999 | -9999 | -9999 | -9999 | -9999 | 1633.25 | 882.55 | 1031.2 | -9999 |
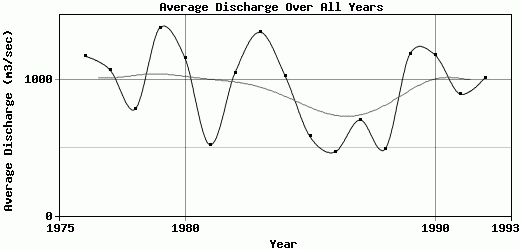
| 1976 | 2081.94 | 1418.58 | 2541.13 | 2637.54 | 1508.92 | 702.92 | 720.91 | 406.06 | 362.22 | 250.46 | 413.98 | 1103.08 | 1178.98 |
| 1977 | 1584.38 | 929.71 | 2829.96 | 2903.25 | 494.66 | 367.69 | 222.08 | 310.7 | 402.1 | 724.55 | 1369.98 | 800.46 | 1078.29 |
| 1978 | 1873.85 | 1370.74 | 1301.03 | 686.27 | 1707.19 | 761.07 | 271.61 | 358.68 | 235.88 | 193.36 | 215.54 | 457.39 | 786.05 |
| 1979 | 1576.98 | 1698.01 | 3101.17 | 4179.12 | 1240.01 | 824.54 | 645.98 | 425.1 | 549.68 | 733.84 | 1003.37 | 672.98 | 1387.56 |
| 1980 | 1503.63 | 1466.92 | 3186.03 | 3568.89 | 1762.69 | 559.02 | 334.54 | 237.85 | 200.34 | 365.21 | 400.5 | 388.27 | 1164.49 |
| 1981 | 272.27 | 1531.13 | 802.47 | 1310.63 | 284.57 | 443.36 | 240.32 | 197.88 | 248.1 | 185.05 | 218.39 | 553.37 | 523.96 |
| 1982 | 1751.36 | 2593.33 | 1398.04 | 1465.97 | 979.13 | 459.9 | 423.32 | 389.86 | 197.45 | 318.42 | 475.75 | 2209.64 | 1055.18 |
| 1983 | 1455.31 | 2345.86 | 2248.37 | 3042.57 | 1464.35 | 755.5 | 452.52 | 274.78 | 374.78 | 282.92 | 916.83 | 2647.18 | 1355.08 |
| 1984 | 2185.8 | 1322.89 | 1701.03 | 1536.1 | 1557.71 | 428.39 | 447.07 | 1246.86 | 336.39 | 333.74 | 451.47 | 869.15 | 1034.72 |
| 1985 | 523.59 | 1829.99 | 823.29 | 416.73 | 493.99 | 242.74 | 504.64 | 518.02 | 261.99 | 354.94 | 416.07 | 633.95 | 584.99 |
| 1986 | 392.68 | 746.2 | 1143.58 | 258.5 | 232.09 | 219.64 | 184.22 | 183.52 | 155.35 | 152.87 | 805.04 | 1167.67 | 470.11 |
| 1987 | 1516.51 | 1796.11 | 2030.33 | 781.57 | 410.26 | 442.95 | 381.56 | 225.69 | 202.53 | 190.15 | 187.14 | 317.33 | 706.84 |
| 1988 | 1014.66 | 921.38 | 482.03 | 456.74 | 235.93 | 197.78 | 214.77 | 167.32 | 608.51 | 346.23 | 766.67 | 486.73 | 491.56 |
| 1989 | 1428.18 | 782.05 | 2047.78 | 1668.15 | 562.69 | 1768.96 | 1687.24 | 418.27 | 428.38 | 986.89 | 982.7 | 1571.41 | 1194.39 |
| 1990 | 2451.7 | 3566.83 | 4105.78 | 1135.79 | 739.35 | 337.42 | 320.18 | 255.03 | 204.71 | 263.07 | 307.69 | 568.4 | 1188 |
| 1991 | 790.5 | 1411.2 | 1430.65 | 1277.85 | 2127.25 | 840.17 | 604.8 | 364.83 | 357.57 | 273.47 | 539.79 | 775.61 | 899.47 |
| 1992 | 1523.91 | 1720.99 | 1567.39 | 717.08 | 307.71 | 538.87 | 343.46 | 489.57 | 534.71 | 343.3 | 1849.19 | 2291.12 | 1018.94 |
| 1993 | 2551.82 | 1574.53 | 1802.06 | 1297.39 | 633.11 | 327.42 | 301.63 | 295.35 | 233.7 | -9999 | -9999 | -9999 | -9999 |
| |
|
|
|
|
|
|
|
|
|
|
|
|
|
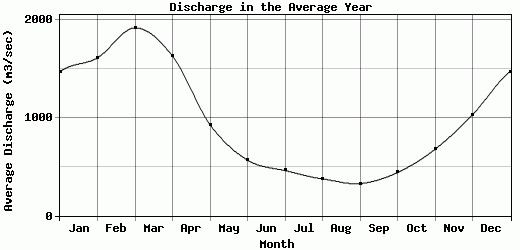
| Avg | 1471.06 | 1612.58 | 1919.01 | 1630.01 | 930.09 | 567.69 | 461.16 | 375.85 | 327.47 | 440.65 | 677.93 | 1030.27 | 948.15 |
| |
|
|
|
|
|
|
|
|
|
|
|
|
|
| Std Dev | 643.59 |
668.87 |
922.83 |
1122.51 |
602.12 |
353.67 |
332.49 |
234.15 |
131.79 |
360.37 |
428.3 |
680.08 |
292.41 |
| |
|
|
|
|
|
|
|
|
|
|
|
|
|
| | Jan | Feb | Mar | Apr | May | Jun | Jul | Aug | Sep | Oct | Nov | Dec | Avg Annual |
Click here for this table in tab-delimited format.
Tab-delimited format will open in most table browsing software, i.e. Excel, etc.
View this station on the map.
Return to start.