Results
| Country: | U.S.A.
| | Station: | BEVILL L&D NR PICKENSVILLE, A | | River: | TOMBIGBEE RIVER | | Area: | 14891.62 | | Lat: | 33.21 | | Lon: | -88.29 | | Source: | USGS | | PointID: | 2444160 | | Area Units: | km2 | | Discharge Units: | m3/sec | | Starting Year: | 1980 | | Ending Year: | 1993 | | Total Years: | 14 | | Total Usable Years: | 13 | |
| |
| Year | Jan | Feb | Mar | Apr | May | Jun | Jul | Aug | Sep | Oct | Nov | Dec | Avg Annual |
|---|
| 1980 | -9999 | -9999 | -9999 | -9999 | -9999 | -9999 | -9999 | -9999 | -9999 | 73.93 | 156.19 | 106.23 | -9999 |
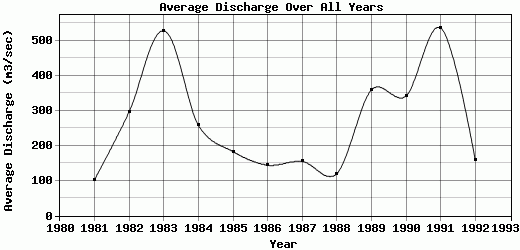
| 1981 | 58.33 | 237.43 | 243.59 | 286.26 | 97.72 | 99.82 | 36.62 | 21.81 | 32.63 | 26.97 | 22.1 | 67.51 | 102.57 |
| 1982 | 605.14 | 362.03 | 271.7 | 650.3 | 129.97 | 80.28 | 75.24 | 90.57 | 36.54 | 49.43 | 109.62 | 1097.4 | 296.52 |
| 1983 | 578.85 | 904.66 | 742.64 | 1252.12 | 1009.46 | 232.56 | 94.99 | 26.91 | 37.9 | 34.03 | 234.29 | 1193.84 | 528.52 |
| 1984 | 459.75 | 314.16 | 417.24 | 578.9 | 619.53 | 57.18 | 39.69 | 33.38 | 13.72 | 184.9 | 194.42 | 186.75 | 258.3 |
| 1985 | 179.69 | 661.8 | 154.25 | 189.51 | 347.99 | 85.62 | 62.36 | 88.66 | 52.06 | 122.17 | 115.14 | 138.77 | 183.17 |
| 1986 | 70.03 | 171.48 | 241.25 | 60.27 | 90.36 | 201.42 | 35.66 | 26.66 | 25.97 | 57.4 | 398.12 | 355.42 | 144.5 |
| 1987 | 360.27 | 468.97 | 511.2 | 105.36 | 72 | 80.05 | 42.76 | 21.12 | 26.8 | 19.65 | 50.16 | 102.19 | 155.04 |
| 1988 | 178.39 | 229.85 | 156.45 | 237.27 | 46.76 | 22.33 | 28.39 | 23.19 | 58.57 | 85.14 | 196.41 | 179.21 | 120.16 |
| 1989 | 849.25 | 644.86 | 657.32 | 286.45 | 254.5 | 513.94 | 385.2 | 79.08 | 85.18 | 165.94 | 234.8 | 160.39 | 359.74 |
| 1990 | 771.79 | 1065.2 | 612.57 | 161.88 | 256.62 | 156.25 | 44.37 | 24.2 | 21.79 | 29.58 | 44.92 | 920.17 | 342.44 |
| 1991 | 315.37 | 1149.43 | 538.31 | 1166.37 | 1983.19 | 325.69 | 61.88 | 47.63 | 45.76 | 38.62 | 64.56 | 707.05 | 536.99 |
| 1992 | 144.14 | 257.29 | 295.75 | 157.81 | 42.16 | 102.09 | 71.96 | 96.08 | 77.99 | 35.57 | 297.04 | 321.74 | 158.3 |
| 1993 | 411.53 | 329.61 | 323.16 | 398.94 | 333.04 | 77.83 | 46.45 | 87.48 | 49.58 | -9999 | -9999 | -9999 | -9999 |
| |
|
|
|
|
|
|
|
|
|
|
|
|
|
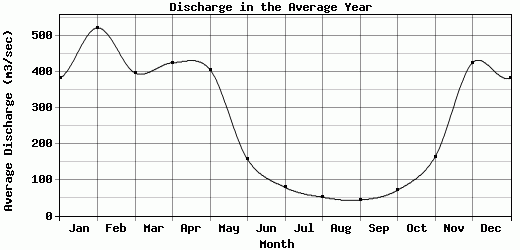
| Avg | 383.27 | 522.83 | 397.34 | 425.5 | 406.41 | 156.54 | 78.89 | 51.29 | 43.42 | 71.03 | 162.91 | 425.9 | 265.52 |
| |
|
|
|
|
|
|
|
|
|
|
|
|
|
| Std Dev | 249.87 |
320.78 |
188.74 |
373.53 |
525.88 |
130.41 |
90.3 |
30.21 |
20.4 |
52.2 |
106.34 |
390.88 |
144.77 |
| |
|
|
|
|
|
|
|
|
|
|
|
|
|
| | Jan | Feb | Mar | Apr | May | Jun | Jul | Aug | Sep | Oct | Nov | Dec | Avg Annual |
Click here for this table in tab-delimited format.
Tab-delimited format will open in most table browsing software, i.e. Excel, etc.
View this station on the map.
Return to start.