Results
| Country: | U.S.A.
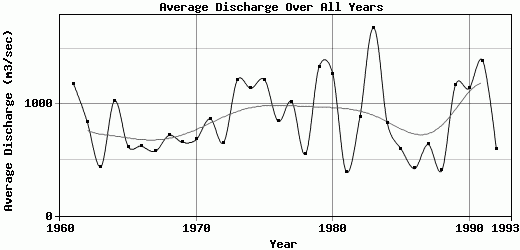
| | Station: | COFFEEVILLE L&D NR COFFEEVILLE, A | | River: | TOMBIGBEE R | | Area: | 47697.20 | | Lat: | 31.75 | | Lon: | -88.12 | | Source: | USGS | | PointID: | 2469761 | | Area Units: | km2 | | Discharge Units: | m3/sec | | Starting Year: | 1960 | | Ending Year: | 1993 | | Total Years: | 34 | | Total Usable Years: | 33 | |
| |
| Year | Jan | Feb | Mar | Apr | May | Jun | Jul | Aug | Sep | Oct | Nov | Dec | Avg Annual |
|---|
| 1960 | -9999 | -9999 | -9999 | -9999 | -9999 | -9999 | -9999 | -9999 | -9999 | 148.01 | 238.22 | 291.98 | -9999 |
| 1961 | 530.08 | 1800.25 | 4310.85 | 2400.9 | 400.13 | 387.97 | 558.11 | 238.53 | 160.81 | 88.45 | 462.94 | 2828.14 | 1180.6 |
| 1962 | 2904.59 | 2025.17 | 1627.31 | 2277.91 | 352.71 | 251.81 | 138.42 | 96.68 | 92.4 | 79.67 | 145.28 | 117.29 | 842.44 |
| 1963 | 507.71 | 670.3 | 1199.27 | 348.05 | 617.88 | 480.59 | 636.84 | 197.86 | 95.81 | 50.6 | 82.74 | 390.53 | 439.85 |
| 1964 | 1026.66 | 989.63 | 2768.12 | 3415.5 | 1574.57 | 164.73 | 361.4 | 233.7 | 90.97 | 334.98 | 291.99 | 1129.39 | 1031.8 |
| 1965 | 1067.19 | 2179.2 | 1498.97 | 1346.95 | 185.32 | 267.12 | 199.21 | 154.2 | 140.61 | 132.59 | 103.75 | 164.12 | 619.94 |
| 1966 | 619.66 | 2196.99 | 1047.09 | 779.13 | 1339.76 | 200.39 | 126.68 | 178 | 205.15 | 184.44 | 219.62 | 389.69 | 623.88 |
| 1967 | 511.51 | 837.68 | 608.61 | 219.94 | 552.04 | 134.18 | 500.07 | 616.9 | 245.07 | 158.73 | 368.01 | 2180.23 | 577.75 |
| 1968 | 2959.4 | 531.97 | 1135.88 | 1201.96 | 1052.3 | 201.03 | 361.01 | 219.82 | 126.69 | 71.58 | 110.54 | 686.32 | 721.54 |
| 1969 | 813.19 | 1438.81 | 1085 | 2272.16 | 936.2 | 198.19 | 138.14 | 110.99 | 93.89 | 112.57 | 157.65 | 531.96 | 657.4 |
| 1970 | 1084.18 | 665.25 | 1595.53 | 1845.98 | 1214 | 410.12 | 135.48 | 226.2 | 107.43 | 311.5 | 250.72 | 362.25 | 684.05 |
| 1971 | 911.81 | 1545.7 | 3106.92 | 1045.75 | 1112.58 | 277.31 | 336.68 | 265.3 | 276.2 | 134.25 | 127.14 | 1301.07 | 870.06 |
| 1972 | 2546.34 | 1116.67 | 1122.27 | 589.65 | 393.3 | 189.73 | 189 | 128.84 | 113.94 | 113.66 | 282.69 | 1080.43 | 655.54 |
| 1973 | 2267.37 | 1672.42 | 2352.96 | 3098.64 | 1562.82 | 918.6 | 610.7 | 309.57 | 156.95 | 170.04 | 331.8 | 1138.43 | 1215.86 |
| 1974 | 3140.45 | 2737.85 | 1062.16 | 2391.28 | 804.39 | 942.58 | 223.5 | 233.07 | 793.67 | 153.09 | 257.6 | 983.77 | 1143.62 |
| 1975 | 2749.22 | 2320.98 | 2551.45 | 2138.12 | 789.4 | 478.98 | 369.83 | 619.69 | 291.34 | 1128.2 | 454.41 | 767.85 | 1221.62 |
| 1976 | 1435.03 | 1149.38 | 2315.51 | 2006.54 | 1235.53 | 397.01 | 226.66 | 177.71 | 226.87 | 121.16 | 183.98 | 680.27 | 846.3 |
| 1977 | 1479.43 | 675.24 | 3313.18 | 2572.22 | 278.38 | 149.28 | 179.41 | 172.22 | 305.65 | 831.79 | 1076.9 | 1249.51 | 1023.6 |
| 1978 | 1296.1 | 820.69 | 1117.15 | 392.31 | 1484.89 | 710.66 | 170.12 | 145.81 | 88.64 | 52.76 | 69.32 | 281.52 | 552.5 |
| 1979 | 1945.83 | 1715.91 | 2674.49 | 4189.41 | 775.7 | 447.96 | 630.76 | 252.05 | 939.77 | 297.47 | 1120.13 | 1029.28 | 1334.9 |
| 1980 | 1562.92 | 1273.09 | 3490.75 | 4859.2 | 2060.56 | 402.59 | 213.97 | 137.27 | 130.38 | 291.34 | 422.37 | 463.88 | 1275.69 |
| 1981 | 217.73 | 906.54 | 831.24 | 1490.84 | 215.05 | 298.05 | 125.06 | 111.56 | 119.19 | 81 | 55.88 | 270.77 | 393.58 |
| 1982 | 1664.67 | 1607.8 | 1018.86 | 1774.06 | 624.91 | 352.4 | 295.87 | 341.49 | 113.31 | 109.03 | 219.92 | 2540.49 | 888.57 |
| 1983 | 1807.36 | 3591.81 | 3256 | 3720.38 | 2498.56 | 1285.97 | 357.06 | 130.74 | 149.74 | 105.13 | 479.1 | 2858.37 | 1686.69 |
| 1984 | 1749.9 | 1055.35 | 1396.03 | 1619.54 | 1977.9 | 224.41 | 189.47 | 248.62 | 81.83 | 357.23 | 380.4 | 723.52 | 833.68 |
| 1985 | 447.03 | 2278 | 735.51 | 549.82 | 815.52 | 247.35 | 311.46 | 364.51 | 155.06 | 384.21 | 384.57 | 550.19 | 601.94 |
| 1986 | 326.85 | 561.17 | 670.25 | 163.71 | 251.08 | 424.09 | 122.13 | 93.88 | 105.33 | 163.56 | 903.89 | 1303.95 | 424.16 |
| 1987 | 1837.86 | 1489.47 | 2420.74 | 501.61 | 283.19 | 337.62 | 228.16 | 116.03 | 99.61 | 39.67 | 97.72 | 220.14 | 639.32 |
| 1988 | 639.65 | 796.17 | 441.81 | 718.54 | 126.28 | 72.42 | 154.56 | 88.5 | 283.16 | 324.7 | 669.69 | 551.05 | 405.54 |
| 1989 | 2366.57 | 1411.7 | 2365.11 | 1457.78 | 745.1 | 1405.68 | 1644.4 | 243.89 | 220.5 | 494.17 | 800.62 | 913.27 | 1172.4 |
| 1990 | 2829.14 | 4563.08 | 2761.27 | 776.92 | 652.75 | 407.6 | 185.45 | 108.83 | 82.48 | 64.29 | 107.15 | 1172.63 | 1142.63 |
| 1991 | 1412.01 | 2018.19 | 2468.33 | 2798.95 | 4336.16 | 1534.78 | 281.24 | 175.76 | 183.53 | 107.6 | 255.94 | 1125.69 | 1391.52 |
| 1992 | 805.48 | 1120.96 | 936.74 | 546.72 | 132.05 | 313.73 | 219.66 | 353.45 | 362.5 | 131.89 | 1019.4 | 1225.03 | 597.3 |
| 1993 | 1872.39 | 1198.62 | 1186.12 | 1176.67 | 860.56 | 229.59 | 186.41 | 235.88 | 149.42 | -9999 | -9999 | -9999 | -9999 |
| |
|
|
|
|
|
|
|
|
|
|
|
|
|
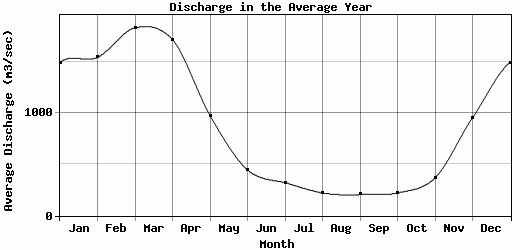
| Avg | 1495.01 | 1544.3 | 1832.47 | 1717.79 | 977.02 | 446.8 | 321.42 | 222.05 | 205.69 | 222.1 | 367.64 | 954.64 | 865.51 |
| |
|
|
|
|
|
|
|
|
|
|
|
|
|
| Std Dev | 847.09 |
867.49 |
987.49 |
1184.72 |
834.04 |
361.39 |
278.03 |
125.59 |
184.21 |
224.91 |
298.21 |
715.92 |
327.64 |
| |
|
|
|
|
|
|
|
|
|
|
|
|
|
| | Jan | Feb | Mar | Apr | May | Jun | Jul | Aug | Sep | Oct | Nov | Dec | Avg Annual |
Click here for this table in tab-delimited format.
Tab-delimited format will open in most table browsing software, i.e. Excel, etc.
View this station on the map.
Return to start.