Results
| Country: | U.S.A.
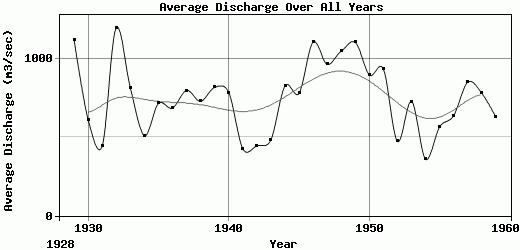
| | Station: | LEROY, AL. | | River: | TOMBIGBEE RIVER | | Area: | 49116.44 | | Lat: | 31.57 | | Lon: | -88.03 | | Source: | USGS | | PointID: | 2470000 | | Area Units: | km2 | | Discharge Units: | m3/sec | | Starting Year: | 1928 | | Ending Year: | 1960 | | Total Years: | 33 | | Total Usable Years: | 32 | |
| |
| Year | Jan | Feb | Mar | Apr | May | Jun | Jul | Aug | Sep | Oct | Nov | Dec | Avg Annual |
|---|
| 1928 | -9999 | -9999 | -9999 | -9999 | -9999 | -9999 | -9999 | -9999 | -9999 | 142.16 | 167.83 | 173.64 | -9999 |
| 1929 | 587.96 | 1180.31 | 3512.13 | 2297.83 | 1522.72 | 299.27 | 181.04 | 123.2 | 176.11 | 206.72 | 1843.17 | 1530.76 | 1121.77 |
| 1930 | 929.71 | 1146.54 | 1426.35 | 584.26 | 893.71 | 702.06 | 91.41 | 136.85 | 174.57 | 105.56 | 585.98 | 564.6 | 611.8 |
| 1931 | 834.89 | 512.07 | 792.78 | 1016.01 | 409.53 | 83.54 | 175.41 | 227.28 | 51.99 | 37.67 | 52.75 | 1123.08 | 443.08 |
| 1932 | 1906.28 | 2506.45 | 1636.36 | 1118.43 | 538.55 | 216.18 | 613.18 | 258.6 | 515.85 | 1316.28 | 1327.6 | 2398.63 | 1196.03 |
| 1933 | 2690.85 | 1715 | 1685.59 | 1850.8 | 520.2 | 153.44 | 411.39 | 181.4 | 153.02 | 86.5 | 94.29 | 220.33 | 813.57 |
| 1934 | 529.33 | 411.53 | 1760.22 | 671.02 | 277.98 | 310.11 | 272.58 | 276.38 | 113.42 | 458.32 | 495.03 | 540.45 | 509.7 |
| 1935 | 1079.97 | 942.15 | 2593.93 | 1684.39 | 1138.53 | 303.46 | 114.99 | 91.92 | 65.48 | 52.4 | 204.72 | 301.69 | 714.47 |
| 1936 | 1808.54 | 2539.55 | 619.41 | 1788.88 | 374.41 | 92.41 | 253.43 | 191.53 | 78.41 | 57.12 | 73.64 | 347.23 | 685.38 |
| 1937 | 2201.69 | 2349 | 1189.77 | 851.59 | 1380.89 | 168.14 | 140.89 | 119.23 | 313.24 | 283.76 | 281.44 | 286.64 | 797.19 |
| 1938 | 845.58 | 722.79 | 1264.03 | 3892.64 | 477.46 | 438.45 | 358.07 | 373.55 | 97.37 | 46.24 | 112.5 | 114.34 | 728.58 |
| 1939 | 626.85 | 1990.38 | 2228.46 | 1310.13 | 435 | 1540.35 | 415.1 | 756.34 | 162.45 | 94.61 | 91.67 | 151.24 | 816.88 |
| 1940 | 445.94 | 1812.59 | 1404.43 | 1257.65 | 604.04 | 374.52 | 2168.08 | 243 | 101.91 | 77.48 | 222 | 693.8 | 783.79 |
| 1941 | 633.66 | 716.42 | 1120.81 | 584.82 | 141.18 | 83.49 | 345.86 | 472.45 | 96.51 | 86.39 | 188.16 | 643.9 | 426.14 |
| 1942 | 553.48 | 871.55 | 1695.82 | 729.74 | 216.2 | 233.39 | 127.85 | 226.79 | 112.07 | 62.23 | 89.73 | 422.77 | 445.13 |
| 1943 | 1100.25 | 683.65 | 1627.04 | 1397.63 | 289.6 | 115.16 | 149.29 | 85.67 | 101.87 | 38.74 | 96.58 | 115.09 | 483.38 |
| 1944 | 392.78 | 994.42 | 2208.45 | 3623.63 | 1531.95 | 195.37 | 115.22 | 259.2 | 166.87 | 71.48 | 88.89 | 269.48 | 826.48 |
| 1945 | 1071.75 | 1585.15 | 2910.53 | 1430.39 | 909.82 | 195.75 | 152.12 | 151.43 | 63.71 | 101.03 | 163.46 | 614.13 | 779.11 |
| 1946 | 2394.7 | 3049.24 | 2269.47 | 898.31 | 879.2 | 577.15 | 726.47 | 649.24 | 334.14 | 134.93 | 751.23 | 596.03 | 1105.01 |
| 1947 | 2788.13 | 1735.23 | 1750.81 | 2039.77 | 851.89 | 542.97 | 369.52 | 119 | 101.45 | 61.09 | 402.98 | 799.89 | 963.56 |
| 1948 | 587.62 | 2529.2 | 3356.3 | 1804.36 | 266.25 | 158.86 | 135.24 | 136.68 | 107.97 | 82.01 | 801.1 | 2609 | 1047.88 |
| 1949 | 3116.7 | 3224.09 | 1643.76 | 1958.21 | 1095.78 | 515.49 | 397.7 | 207.71 | 345.6 | 126.35 | 222.65 | 391.51 | 1103.8 |
| 1950 | 2002.93 | 2009.7 | 2166.89 | 920.4 | 727.34 | 301.17 | 292.51 | 278.68 | 1011.88 | 180.47 | 262.01 | 593.62 | 895.63 |
| 1951 | 1158.17 | 2125.49 | 1620.1 | 3741.15 | 556.46 | 245.97 | 204.06 | 99.61 | 107.72 | 89.51 | 221.27 | 1017.81 | 932.28 |
| 1952 | 1248.23 | 1041.77 | 1494.22 | 768.9 | 316.26 | 151.67 | 62.29 | 124.81 | 74.08 | 62.72 | 78.22 | 245.17 | 472.36 |
| 1953 | 1125.37 | 1368.12 | 2183.79 | 784.76 | 1915.87 | 165.51 | 297.74 | 87.03 | 57.03 | 45.22 | 63.25 | 628.49 | 726.85 |
| 1954 | 1040.56 | 773.86 | 679.61 | 947.68 | 436.05 | 122.72 | 67.06 | 24.54 | 20.42 | 31.5 | 61.21 | 112.04 | 359.77 |
| 1955 | 644.81 | 1289.64 | 1092.89 | 2230.62 | 443.07 | 268.8 | 302.11 | 164.56 | 44.97 | 40.96 | 104.4 | 160.98 | 565.65 |
| 1956 | 116.19 | 1926.01 | 1788.81 | 1969.07 | 462 | 138.57 | 287.31 | 63.07 | 56.31 | 84.18 | 86.64 | 668.81 | 637.25 |
| 1957 | 686.15 | 2018.6 | 1094.95 | 1498.35 | 381.06 | 291.78 | 282.62 | 64.64 | 212.33 | 365.66 | 1337.84 | 1968.31 | 850.19 |
| 1958 | 853.8 | 1458.33 | 1764.24 | 1103.7 | 1900.98 | 221.61 | 798.06 | 232.33 | 273.92 | 237.95 | 204.59 | 294.51 | 778.67 |
| 1959 | 827.07 | 1537.92 | 1022.24 | 1185.07 | 483.11 | 819.24 | 170.85 | 95.42 | 164.64 | 317.94 | 338.87 | 561.3 | 626.97 |
| 1960 | 1228.59 | 1870.97 | 2317.43 | 1042.82 | 480.93 | 154.2 | 84.44 | 134.78 | 127.85 | -9999 | -9999 | -9999 | -9999 |
| |
|
|
|
|
|
|
|
|
|
|
|
|
|
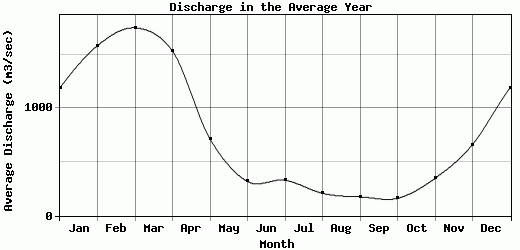
| Avg | 1189.33 | 1582.43 | 1747.55 | 1530.72 | 714.31 | 318.15 | 330.12 | 208.03 | 174.54 | 162.04 | 347.37 | 661.23 | 749.95 |
| |
|
|
|
|
|
|
|
|
|
|
|
|
|
| Std Dev | 755.41 |
723.51 |
688.49 |
863.01 |
475.95 |
282.75 |
374.54 |
158.54 |
183.47 |
231.14 |
423 |
624.61 |
223.19 |
| |
|
|
|
|
|
|
|
|
|
|
|
|
|
| | Jan | Feb | Mar | Apr | May | Jun | Jul | Aug | Sep | Oct | Nov | Dec | Avg Annual |
Click here for this table in tab-delimited format.
Tab-delimited format will open in most table browsing software, i.e. Excel, etc.
View this station on the map.
Return to start.