Results
| Country: | U.S.A.
| | Station: | COLUMBIA, MS | | River: | PEARL RIVER | | Area: | 14813.92 | | Lat: | 31.24 | | Lon: | -89.84 | | Source: | USGS | | PointID: | 2489000 | | Area Units: | km2 | | Discharge Units: | m3/sec | | Starting Year: | 1928 | | Ending Year: | 1954 | | Total Years: | 27 | | Total Usable Years: | 26 | |
| |
| Year | Jan | Feb | Mar | Apr | May | Jun | Jul | Aug | Sep | Oct | Nov | Dec | Avg Annual |
|---|
| 1928 | -9999 | -9999 | -9999 | -9999 | -9999 | -9999 | -9999 | -9999 | -9999 | 31.92 | 31.72 | 45.98 | -9999 |
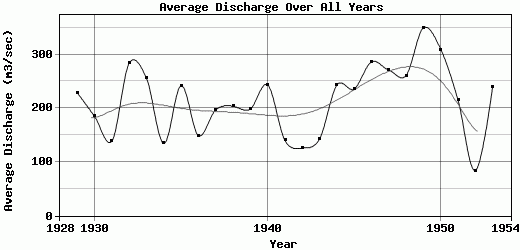
| 1929 | 123.18 | 280.68 | 619.23 | 394.63 | 207.05 | 91.4 | 62.15 | 67.56 | 48.52 | 33.41 | 571.23 | 247.41 | 228.87 |
| 1930 | 283.17 | 368.12 | 297.33 | 150.08 | 311.49 | 218.04 | 42.48 | 37.66 | 42.15 | 65.26 | 159.04 | 242.16 | 184.75 |
| 1931 | 286.67 | 134.84 | 184.59 | 152.26 | 115.68 | 51.16 | 108.68 | 217.58 | 39.14 | 27 | 39.79 | 307.6 | 138.75 |
| 1932 | 698.33 | 598.11 | 337.47 | 324.72 | 95.72 | 68.86 | 52.61 | 42.59 | 68.39 | 155.31 | 251.32 | 712.36 | 283.82 |
| 1933 | 723.16 | 443.59 | 433.36 | 731.99 | 235.25 | 58.46 | 186.54 | 92.46 | 51.97 | 33.63 | 30.79 | 46.8 | 255.67 |
| 1934 | 50.4 | 120.75 | 415.56 | 120.31 | 75.14 | 190.37 | 133.23 | 74.56 | 52.74 | 64.01 | 117.22 | 202.54 | 134.74 |
| 1935 | 374.13 | 232.2 | 1000.24 | 447.03 | 451.92 | 107.58 | 58.84 | 51.56 | 36.27 | 26.28 | 37.65 | 79.67 | 241.95 |
| 1936 | 271.03 | 694.25 | 129.55 | 184.84 | 232.23 | 44.91 | 53.41 | 39.15 | 29.24 | 21.84 | 22.29 | 64.84 | 148.97 |
| 1937 | 660.21 | 518.76 | 315.82 | 237.21 | 217.9 | 90.96 | 55.37 | 51.66 | 60.21 | 34.06 | 60.26 | 60.52 | 196.91 |
| 1938 | 222.32 | 223.74 | 247.3 | 1142.87 | 137.34 | 112.74 | 101.59 | 119.57 | 41.18 | 27.07 | 28.1 | 40.85 | 203.72 |
| 1939 | 224.69 | 578.74 | 609.35 | 351.79 | 114.89 | 226.46 | 80.52 | 50.31 | 31.12 | 39.72 | 28.96 | 46.83 | 198.61 |
| 1940 | 74.6 | 376.77 | 209.65 | 361.74 | 374.79 | 70.86 | 732.68 | 158.34 | 51.77 | 42.32 | 65.35 | 403.86 | 243.56 |
| 1941 | 269.64 | 214.34 | 325.66 | 277.67 | 82.66 | 44.43 | 116.73 | 76.61 | 36.86 | 31.79 | 39.68 | 162.62 | 139.89 |
| 1942 | 168.1 | 173.92 | 372.3 | 170.94 | 136.12 | 54.57 | 56.3 | 94.45 | 63.11 | 39.4 | 44 | 139.07 | 126.02 |
| 1943 | 240.37 | 176.23 | 454.49 | 447.39 | 71.84 | 49.39 | 49.89 | 32.8 | 49.09 | 27.64 | 52.92 | 62.64 | 142.89 |
| 1944 | 168.14 | 288.56 | 569.26 | 918.79 | 530.98 | 108.61 | 53.71 | 71.32 | 44.42 | 31.84 | 44.72 | 87.28 | 243.14 |
| 1945 | 242.98 | 506.15 | 805.66 | 450.12 | 175.09 | 195.09 | 123.8 | 81.4 | 38.39 | 54.51 | 42.77 | 114.5 | 235.87 |
| 1946 | 437.24 | 830.9 | 540.58 | 259.73 | 307.04 | 295.17 | 208.43 | 172.25 | 51.38 | 38.75 | 137.93 | 157.92 | 286.44 |
| 1947 | 772.06 | 382.51 | 448.4 | 775.13 | 274.57 | 100.88 | 75.52 | 48.95 | 51.15 | 36.06 | 90.52 | 196.77 | 271.04 |
| 1948 | 168.02 | 536.56 | 793.06 | 349.16 | 86.44 | 46.79 | 43.88 | 56.06 | 49.83 | 40.36 | 224.2 | 737.06 | 260.95 |
| 1949 | 829.69 | 868.83 | 524.14 | 752.59 | 356.83 | 217.64 | 184.82 | 130.36 | 136.9 | 56.07 | 62.62 | 76.06 | 349.71 |
| 1950 | 842.37 | 786.81 | 690.93 | 232.06 | 433.61 | 121.96 | 92.45 | 136.18 | 84.33 | 77.4 | 74.5 | 142.64 | 309.6 |
| 1951 | 295.28 | 616.4 | 379.13 | 743.51 | 147.97 | 59.15 | 60.6 | 41.38 | 37.94 | 33.19 | 35.16 | 126.88 | 214.72 |
| 1952 | 105.11 | 192.14 | 208.24 | 162.35 | 100.16 | 56.08 | 34.73 | 32.67 | 25.59 | 21.24 | 24.68 | 41.67 | 83.72 |
| 1953 | 181.04 | 390.54 | 658.14 | 232.71 | 964.15 | 105.46 | 93.33 | 67.67 | 38.45 | 27.09 | 29.62 | 91.43 | 239.97 |
| 1954 | 130.25 | 178.86 | 136.78 | 210.34 | 263.72 | 46.01 | 44.22 | 29.11 | 23.97 | -9999 | -9999 | -9999 | -9999 |
| |
|
|
|
|
|
|
|
|
|
|
|
|
|
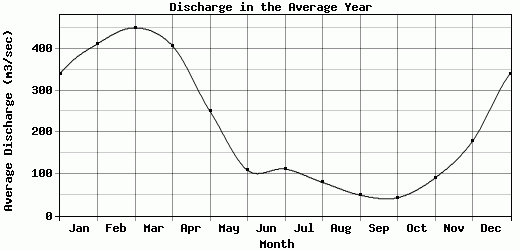
| Avg | 340.08 | 412.05 | 450.24 | 407 | 250.02 | 108.96 | 111.79 | 79.78 | 49.39 | 42.97 | 90.27 | 178.38 | 214.57 |
| |
|
|
|
|
|
|
|
|
|
|
|
|
|
| Std Dev | 243.84 |
220.64 |
218.46 |
266.21 |
190.44 |
69.05 |
132.68 |
47.66 |
21.91 |
26.36 |
112.9 |
180.89 |
63.77 |
| |
|
|
|
|
|
|
|
|
|
|
|
|
|
| | Jan | Feb | Mar | Apr | May | Jun | Jul | Aug | Sep | Oct | Nov | Dec | Avg Annual |
Click here for this table in tab-delimited format.
Tab-delimited format will open in most table browsing software, i.e. Excel, etc.
View this station on the map.
Return to start.