Results
| Country: | U.S.A.
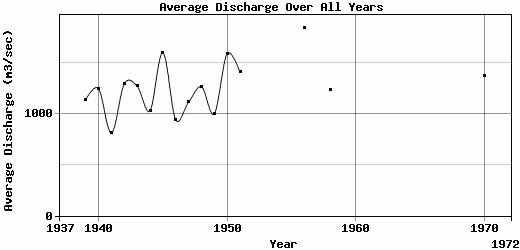
| | Station: | ST. MARYS, WV | | River: | OHIO RIVER | | Area: | 69537.38 | | Lat: | 39.39 | | Lon: | -81.2 | | Source: | USGS | | PointID: | 3115000 | | Area Units: | km2 | | Discharge Units: | m3/sec | | Starting Year: | 1937 | | Ending Year: | 1972 | | Total Years: | 36 | | Total Usable Years: | 31 | |
| |
| Year | Jan | Feb | Mar | Apr | May | Jun | Jul | Aug | Sep | Oct | Nov | Dec | Avg Annual |
|---|
| 1937 | -9999 | -9999 | -9999 | -9999 | -9999 | -9999 | -9999 | -9999 | -9999 | -9999 | 690.93 | 4856.37 | -9999 |
| 1938 | 2922.31 | 2968.87 | 2566.73 | 2592.14 | 3148.85 | 1864.67 | -9999 | -9999 | 84.67 | -9999 | 113.27 | 157.16 | -9999 |
| 1939 | 1364.17 | 3576.94 | 3052.7 | 2886.45 | 605.98 | 474.31 | 311.49 | 126.58 | 85.8 | 371.24 | 172.17 | 625.6 | 1137.79 |
| 1940 | 481.06 | 1375.7 | 2061.02 | 4736.02 | 1026.99 | 1432.93 | 621.28 | 246.8 | 306.42 | 201.65 | 757.2 | 1711.35 | 1246.54 |
| 1941 | 1690.34 | 797.63 | 1517.7 | 1326.09 | 375.39 | 1306.55 | 486.46 | 486.5 | 306.2 | 230.28 | 508.01 | 697.15 | 810.69 |
| 1942 | 823.39 | 1549.34 | 3092.03 | 1941.32 | 1188.22 | 570.02 | 517.91 | 669.47 | 489.13 | 944.22 | 1794.26 | 1932.77 | 1292.67 |
| 1943 | 3250.43 | 2163.82 | 2294.32 | 1948.3 | 2334.6 | 1022.68 | 583.18 | 472.25 | 171.6 | 205.15 | 487.62 | 322.63 | 1271.38 |
| 1944 | 709.72 | 1136.98 | 3101.99 | 2402.23 | 1542.36 | 721.61 | 242.17 | 143.09 | 173.54 | 490.87 | 384.62 | 1305.78 | 1029.58 |
| 1945 | 1404.71 | 2336.96 | 4911.81 | 1799.07 | 1670.16 | 821.1 | 350.45 | 391.4 | 1112.35 | 1265.04 | 1774.15 | 1341.13 | 1598.19 |
| 1946 | 1618.45 | 1204.38 | 2065.31 | 625.71 | 1657.91 | 2130.57 | 417.82 | 245.89 | 118.98 | 256.27 | 276.09 | 681.95 | 941.61 |
| 1947 | 2165.98 | 1131.06 | 1569.49 | 2212.6 | 2077.19 | 1665.7 | 507.16 | 427.68 | 309.39 | 133.98 | 423.05 | 713.67 | 1111.41 |
| 1948 | 937.84 | 1940.89 | 2446.13 | 3096.56 | 1681.39 | 871.69 | 794.25 | 528.62 | 239.82 | 313.5 | 612.17 | 1708.15 | 1264.25 |
| 1949 | 2532.27 | 2237.65 | 1596.8 | 1627.57 | 849.42 | 325.15 | 420.97 | 329.75 | 227.62 | 185.8 | 367.48 | 1288.79 | 999.11 |
| 1950 | 2741.82 | 2875.39 | 2404.57 | 2125.57 | 1269.61 | 1094.07 | 705.55 | 309.03 | 647.8 | 472.04 | 1640.69 | 2782.83 | 1589.08 |
| 1951 | 2843.21 | 3019.91 | 2513 | 2585.06 | 1211.05 | 1267.85 | 717.84 | 192.14 | 178.35 | 138.7 | 682.44 | 1524.19 | 1406.14 |
| 1952 | 3821.33 | 2201.11 | 2234.67 | 1927.54 | 1964.47 | 491.02 | 203.94 | 230.32 | 166.65 | -9999 | 746.62 | 907.39 | -9999 |
| 1953 | 1560.81 | 1446.09 | 1867 | 1825.69 | 1847.09 | 1297.05 | 479.5 | 527.83 | -9999 | -9999 | -9999 | 564.45 | -9999 |
| 1954 | 1268.6 | 1133.19 | 1919.07 | 1814.74 | 1212.31 | 673.27 | 467.23 | 641.6 | -9999 | 2055.92 | 707.17 | 1462.89 | -9999 |
| 1955 | 1753.74 | 2160.18 | 3617.73 | 1361.39 | 717.01 | 954.72 | -9999 | 685.8 | -9999 | 699.03 | 1294.86 | 873.76 | -9999 |
| 1956 | 1662.21 | 3363.96 | 3454.95 | 2686.15 | 2545.97 | 1509.39 | 1232.06 | 1744.6 | 840.35 | 558.25 | 618.57 | 1903.82 | 1843.36 |
| 1957 | 1707.7 | 2059.96 | 1454.49 | 3019.35 | 829.6 | 765.27 | 840.31 | -9999 | -9999 | -9999 | 562.56 | 1869.97 | -9999 |
| 1958 | 1050.01 | 880.89 | 1662.3 | 1962.46 | 2459.49 | 784.26 | 1840.61 | 1327.24 | 742.81 | 539.31 | 768.81 | 790.96 | 1234.1 |
| 1959 | 2346.11 | 2592.42 | 1914.23 | 1836.73 | 1317.75 | 2690.32 | 558.98 | -9999 | -9999 | 896.47 | 1043.58 | 2032.7 | -9999 |
| 1960 | 2135.19 | 1720.79 | 1054.76 | 2618 | 1627.13 | 991.92 | 484.79 | 546.52 | 515.84 | -9999 | 483.51 | 528.58 | -9999 |
| 1961 | 603.91 | 2880.15 | 3282.12 | 2966.39 | 1608.31 | 1220.93 | 587.76 | 822.94 | -9999 | -9999 | 1198.19 | 1027.36 | -9999 |
| 1962 | 1458.51 | 1407.15 | 2638.5 | 2542.77 | 707.78 | 593.71 | -9999 | -9999 | 580.5 | 462.28 | 907.65 | 794.29 | -9999 |
| 1963 | 923.77 | 765.17 | 4254.86 | 1438.03 | 622.52 | 1077.99 | 538.02 | 567.28 | -9999 | -9999 | 460.35 | 731.64 | -9999 |
| 1964 | 1251.94 | 750.99 | 3947.57 | 2600.73 | 938.37 | 764.99 | 574.48 | 479.74 | -9999 | -9999 | 540.03 | 1401.51 | -9999 |
| 1965 | 2281.71 | 1963.48 | 2233.85 | 2161.25 | 743.55 | 459.54 | -9999 | -9999 | 446.7 | 481.39 | 879.95 | 694.41 | -9999 |
| 1966 | 1062.05 | 2353.04 | 1592.42 | 1599.16 | 1828.46 | -9999 | -9999 | -9999 | -9999 | 379.92 | 660.92 | 1294.91 | -9999 |
| 1967 | 521.43 | 1085.86 | 3288.15 | 1678.63 | 2377.62 | -9999 | -9999 | -9999 | -9999 | 854 | 1086.52 | 1326.33 | -9999 |
| 1968 | 1001.69 | 1574.82 | 1604.76 | 1038.1 | 2035.63 | 740.02 | -9999 | 13.98 | 15.01 | -9999 | 1175.94 | 1386.35 | -9999 |
| 1969 | 1375.11 | 1746.52 | 1181.59 | 1764.15 | 1156.43 | -9999 | 785.19 | 929.61 | -9999 | -9999 | 826.86 | 1221.74 | -9999 |
| 1970 | 1269.61 | 2083.73 | 1671.98 | 2633.58 | 1030.65 | 713.31 | 703.03 | 765.97 | 598.62 | 1064.58 | 1752.82 | 2182.42 | 1372.53 |
| 1971 | 1511.03 | 2406.14 | 2403.38 | 916.24 | 1322.77 | 646.89 | -9999 | 600.32 | 1318.24 | 591.83 | 754.45 | 1712.36 | -9999 |
| 1972 | 1792.74 | 1352.58 | 3482.26 | 2616.96 | 1137.52 | 2293.3 | 2947.8 | -9999 | -9999 | -9999 | -9999 | -9999 | -9999 |
| |
|
|
|
|
|
|
|
|
|
|
|
|
|
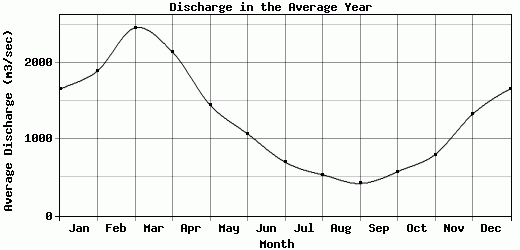
| Avg | 1652.71 | 1892.68 | 2455.84 | 2140.36 | 1447.7 | 1069.9 | 700.75 | 535.29 | 420.71 | 574.65 | 798.63 | 1324.5 | 1259.28 |
| |
|
|
|
|
|
|
|
|
|
|
|
|
|
| Std Dev | 791.09 |
753.64 |
903.51 |
751.35 |
636.84 |
556.4 |
541.55 |
362.3 |
331.18 |
431.26 |
438.94 |
834.89 |
257.45 |
| |
|
|
|
|
|
|
|
|
|
|
|
|
|
| | Jan | Feb | Mar | Apr | May | Jun | Jul | Aug | Sep | Oct | Nov | Dec | Avg Annual |
Click here for this table in tab-delimited format.
Tab-delimited format will open in most table browsing software, i.e. Excel, etc.
View this station on the map.
Return to start.