Results
| Country: | U.S.A.
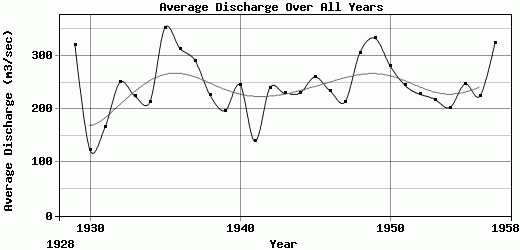
| | Station: | CAPERTON, WV | | River: | NEW RIVER | | Area: | 17678.29 | | Lat: | 38.02 | | Lon: | -81.02 | | Source: | USGS | | PointID: | 3185500 | | Area Units: | km2 | | Discharge Units: | m3/sec | | Starting Year: | 1928 | | Ending Year: | 1958 | | Total Years: | 31 | | Total Usable Years: | 29 | |
| |
| Year | Jan | Feb | Mar | Apr | May | Jun | Jul | Aug | Sep | Oct | Nov | Dec | Avg Annual |
|---|
| 1928 | -9999 | -9999 | -9999 | -9999 | -9999 | -9999 | -9999 | -9999 | -9999 | -9999 | -9999 | 197.9 | -9999 |
| 1929 | 256.08 | 337.74 | 715.78 | 293.98 | 404.66 | 349.55 | 177.98 | 92.6 | 66.78 | 374 | 499.1 | 278.44 | 320.56 |
| 1930 | 221.35 | 318.58 | 292.06 | 211.64 | 113.32 | 65.44 | 33.22 | 41.17 | 34.9 | 30.86 | 47.24 | 64.54 | 122.86 |
| 1931 | 113.55 | 119.27 | 214.03 | 454.58 | 338.16 | 136.82 | 111.33 | 175.11 | 78.15 | 44.1 | 41.96 | 161.37 | 165.7 |
| 1932 | 297.25 | 483.58 | 451.51 | 284.54 | 400.36 | 166.32 | 143.86 | 56.27 | 35.95 | 135.8 | 241.61 | 304.19 | 250.1 |
| 1933 | 379.85 | 516.5 | 443.21 | 406.98 | 326.63 | 135.02 | 117.62 | 111.71 | 59.09 | 42.96 | 50.09 | 97.64 | 223.94 |
| 1934 | 114.82 | 59.63 | 823.17 | 371.4 | 112.14 | 81.43 | 78.4 | 98.53 | 104.55 | 131.26 | 212.75 | 377.98 | 213.84 |
| 1935 | 682.93 | 378.74 | 776.18 | 690.44 | 383.61 | 159.79 | 249.93 | 158.43 | 220.7 | 72.07 | 264.06 | 192.51 | 352.45 |
| 1936 | 744.24 | 639.41 | 826.95 | 584.51 | 163.38 | 98.13 | 82.72 | 82.27 | 62.44 | 155.54 | 82.5 | 241.4 | 313.62 |
| 1937 | 864.86 | 445.59 | 252.31 | 253 | 201.32 | 104.85 | 83.2 | 143.94 | 173.05 | 530.46 | 220.89 | 221.06 | 291.21 |
| 1938 | 267.38 | 285.77 | 378.99 | 220.63 | 255.43 | 298.74 | 369.08 | 219.56 | 84.11 | 58.52 | 132.47 | 142.81 | 226.12 |
| 1939 | 264.75 | 733.41 | 441.7 | 229.26 | 128.13 | 134.16 | 143.3 | 104.17 | 47.72 | 42.83 | 44 | 48.95 | 196.86 |
| 1940 | 54.39 | 213.55 | 198.17 | 440.22 | 243.4 | 409.59 | 209.66 | 603.5 | 235.13 | 87.21 | 109.45 | 139.72 | 245.33 |
| 1941 | 215.86 | 147 | 250.4 | 260.39 | 94.16 | 83.36 | 269.35 | 73.42 | 67.78 | 40.99 | 51.73 | 119.22 | 139.47 |
| 1942 | 125.23 | 181.14 | 308.96 | 134.95 | 355.93 | 279.37 | 138.12 | 313.43 | 164.08 | 229.66 | 208.47 | 444.38 | 240.31 |
| 1943 | 423.29 | 455.05 | 519.15 | 380 | 288.82 | 164.74 | 178.59 | 82.76 | 54.62 | 48.56 | 78.52 | 79.65 | 229.48 |
| 1944 | 200.17 | 434.15 | 641.15 | 387.97 | 258.79 | 110.81 | 78.69 | 52.51 | 62.16 | 181.03 | 97.5 | 253.99 | 229.91 |
| 1945 | 348.46 | 457.64 | 427.48 | 226.83 | 354.83 | 200.28 | 119.86 | 106.16 | 304.87 | 125.05 | 170.55 | 279.83 | 260.15 |
| 1946 | 653.61 | 495.95 | 419.56 | 228.03 | 367.96 | 141.28 | 148.71 | 86.31 | 56.95 | 62.09 | 70.41 | 79.04 | 234.16 |
| 1947 | 478.31 | 172.55 | 445.95 | 315.55 | 153.68 | 134.36 | 92.01 | 118.28 | 90.87 | 146.97 | 262.44 | 151.08 | 213.5 |
| 1948 | 128.68 | 595.39 | 553.37 | 610.79 | 257.84 | 163.06 | 119.1 | 214.14 | 88.14 | 93.8 | 195.54 | 654.72 | 306.21 |
| 1949 | 513.83 | 428.6 | 344.56 | 429.31 | 392.55 | 213.35 | 351.56 | 279.52 | 200.49 | 127.19 | 308.88 | 404.25 | 332.84 |
| 1950 | 349.54 | 655.1 | 357.83 | 193.35 | 371.18 | 276.33 | 180.84 | 128.63 | 191.32 | 102.16 | 113.16 | 458.35 | 281.48 |
| 1951 | 220.67 | 464.3 | 463.84 | 620.24 | 232.35 | 296.47 | 105.74 | 83.6 | 66.57 | 42.61 | 73.51 | 264.65 | 244.55 |
| 1952 | 467.38 | 400.8 | 572.42 | 330.37 | 340.15 | 91.91 | 61.48 | 111.81 | 70.01 | 50.55 | 88.24 | 146.31 | 227.62 |
| 1953 | 346.76 | 519.62 | 554.33 | 298.84 | 331.67 | 174.49 | 110.66 | 53.53 | 41.78 | 40.94 | 46.57 | 97.2 | 218.03 |
| 1954 | 258.76 | 170.66 | 452.87 | 303.81 | 295.44 | 119.75 | 142.78 | 80.34 | 62.04 | 132.04 | 121.55 | 295.12 | 202.93 |
| 1955 | 225.96 | 578.53 | 1124.73 | 346.72 | 174.3 | 114.58 | 89.13 | 88.81 | 51.73 | 51.98 | 54.72 | 63.85 | 247.09 |
| 1956 | 56.8 | 471.04 | 412.4 | 521.49 | 221.87 | 146.55 | 136.33 | 71.29 | 89.37 | 134.21 | 193.62 | 238.31 | 224.44 |
| 1957 | 411.8 | 991.3 | 366.53 | 583.31 | 146.24 | 201.01 | 94.5 | 60.09 | 151.12 | 154.18 | 275.04 | 449.86 | 323.75 |
| 1958 | 330.5 | 428.91 | 557.39 | 716.94 | 601.24 | 151.84 | 169.69 | 193.76 | 63.41 | -9999 | -9999 | -9999 | -9999 |
| |
|
|
|
|
|
|
|
|
|
|
|
|
|
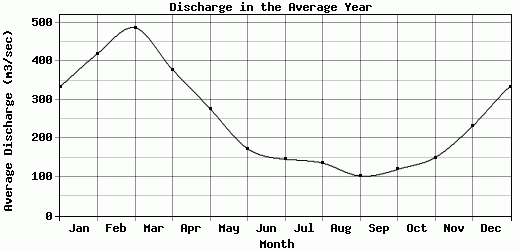
| Avg | 333.9 | 419.32 | 486.23 | 377.67 | 276.98 | 173.45 | 146.25 | 136.19 | 102.66 | 119.64 | 150.23 | 231.61 | 244.09 |
| |
|
|
|
|
|
|
|
|
|
|
|
|
|
| Std Dev | 199.21 |
198.01 |
203.41 |
155.07 |
112.97 |
82.98 |
77.06 |
108.8 |
67.9 |
105.51 |
104.88 |
142.87 |
54.01 |
| |
|
|
|
|
|
|
|
|
|
|
|
|
|
| | Jan | Feb | Mar | Apr | May | Jun | Jul | Aug | Sep | Oct | Nov | Dec | Avg Annual |
Click here for this table in tab-delimited format.
Tab-delimited format will open in most table browsing software, i.e. Excel, etc.
View this station on the map.
Return to start.