Results
| Country: | U.S.A.
| | Station: | DAM 51 AT GOLCONDA,ILL. | | River: | OHIO RIVER | | Area: | 0.00 | | Lat: | 37.35 | | Lon: | -88.48 | | Source: | USGS | | PointID: | 3384500 | | Area Units: | km2 | | Discharge Units: | m3/sec | | Starting Year: | 1970 | | Ending Year: | 1983 | | Total Years: | 14 | | Total Usable Years: | 11 | |
| |
| Year | Jan | Feb | Mar | Apr | May | Jun | Jul | Aug | Sep | Oct | Nov | Dec | Avg Annual |
|---|
| 1970 | -9999 | -9999 | -9999 | -9999 | -9999 | -9999 | -9999 | -9999 | -9999 | 2307.13 | 3996.38 | 5481.71 | -9999 |
| 1971 | 6407.04 | 9441.8 | 10967.8 | 3030.3 | 6294.05 | 2589.78 | 2729.05 | 3251.15 | 3258 | 2079.88 | -9999 | 4400 | -9999 |
| 1972 | 7100.26 | 6855.64 | 12565.4 | 13394.9 | 8366.3 | 3858.6 | 5504.46 | 2595.49 | -9999 | 2926.18 | 7647.48 | 13074.2 | -9999 |
| 1973 | 7031.75 | 7369.5 | 9980.37 | 12412.3 | 9667.06 | 5929.58 | 3715.74 | 2431.12 | -9999 | 2486.23 | 4214.2 | 7763.42 | -9999 |
| 1974 | 14680.1 | 8928.96 | 10338.4 | 9965.7 | 5601.29 | 7534.68 | 4653.57 | 2843.03 | 4344.02 | -9999 | 3203.69 | 7274.73 | -9999 |
| 1975 | 10297.3 | 11994.3 | 16623 | 12320.7 | 9017.59 | 4009.5 | 2494.73 | 2978.95 | 4241.89 | -9999 | -9999 | -9999 | -9999 |
| 1976 | -9999 | -9999 | -9999 | -9999 | -9999 | -9999 | -9999 | -9999 | -9999 | 3801.03 | 4139.63 | 3507.7 | -9999 |
| 1977 | -9999 | 4686.46 | 10375 | 8139.25 | 4898.51 | 2861.9 | 2341.11 | 3977.35 | 2333.08 | 3683.73 | 4789.23 | 10998.9 | -9999 |
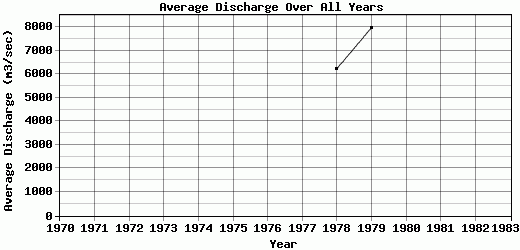
| 1978 | 6583.24 | 5655.61 | 12067.1 | 9389.92 | 9509.94 | 3111.5 | 3084.55 | 2759.96 | 3760.5 | 2441.28 | 3511.53 | 12911.6 | 6232.23 |
| 1979 | 12150.7 | 7133.56 | 16843.1 | 13583.7 | 5170.04 | 4598.4 | 3494.68 | 6119.94 | 6823.26 | 5764.52 | 5808.29 | 8215.58 | 7975.48 |
| 1980 | 6858.19 | 4044.87 | 10146.6 | 11880.9 | 4835.81 | 4383.17 | 3539.82 | 4617.59 | 1200.99 | -9999 | 0 | 0 | -9999 |
| 1981 | -9999 | 0 | 0 | 0 | 0 | 0 | 0 | 0 | 0 | 0 | -9999 | -9999 | -9999 |
| 1982 | -9999 | 0 | 0 | 0 | 0 | 0 | 0 | 0 | 0 | 0 | 0 | 0 | -9999 |
| 1983 | 0 | 0 | 0 | 0 | 0 | 0 | 0 | 0 | 0 | -9999 | -9999 | -9999 | -9999 |
| |
|
|
|
|
|
|
|
|
|
|
|
|
|
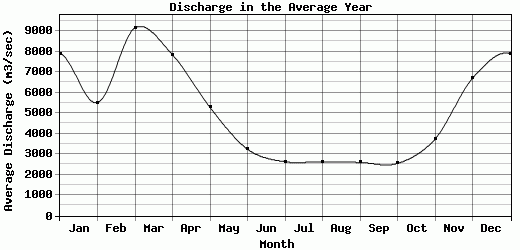
| Avg | 7900.95 | 5509.23 | 9158.9 | 7843.14 | 5280.05 | 3239.76 | 2629.81 | 2631.21 | 2596.17 | 2549 | 3731.04 | 6693.44 | 7103.86 |
| |
|
|
|
|
|
|
|
|
|
|
|
|
|
| Std Dev | 3924.8 |
3775.2 |
5732 |
5289.13 |
3485.15 |
2270.83 |
1736.39 |
1809.85 |
2183.15 |
1631.75 |
2222.87 |
4350.52 |
871.63 |
| |
|
|
|
|
|
|
|
|
|
|
|
|
|
| | Jan | Feb | Mar | Apr | May | Jun | Jul | Aug | Sep | Oct | Nov | Dec | Avg Annual |
Click here for this table in tab-delimited format.
Tab-delimited format will open in most table browsing software, i.e. Excel, etc.
View this station on the map.
Return to start.