Results
| Country: | U.S.A.
| | Station: | CLARKSVILLE, TENN. | | River: | CUMBERLAND RIVER | | Area: | 13286443.41 | | Lat: | 36.52 | | Lon: | -87.36 | | Source: | USGS | | PointID: | 3436500 | | Area Units: | km2 | | Discharge Units: | m3/sec | | Starting Year: | 1924 | | Ending Year: | 1944 | | Total Years: | 21 | | Total Usable Years: | 20 | |
| |
| Year | Jan | Feb | Mar | Apr | May | Jun | Jul | Aug | Sep | Oct | Nov | Dec | Avg Annual |
|---|
| 1924 | -9999 | -9999 | -9999 | -9999 | -9999 | -9999 | -9999 | -9999 | -9999 | 83.62 | 63.63 | 745.04 | -9999 |
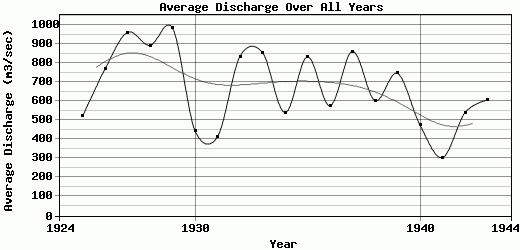
| 1925 | 896.74 | 1357.7 | 720.53 | 607.68 | 637.6 | 131.46 | 127.22 | 42.76 | 31.01 | 277.68 | 898.03 | 512.14 | 520.05 |
| 1926 | 987.39 | 875.6 | 777.26 | 676.68 | 359.21 | 311.24 | 118.24 | 748.01 | 453.84 | 287.76 | 879.06 | 2729.21 | 766.96 |
| 1927 | 2584.25 | 1836.86 | 2308.75 | 1878.64 | 617.22 | 866.48 | 170.41 | 216.98 | 69.16 | 106.73 | 376.77 | 501.57 | 961.15 |
| 1928 | 1153.87 | 689.76 | 1028.27 | 1485.04 | 885.43 | 1870.24 | 1658.1 | 256.37 | 301.54 | 224 | 644.68 | 518.29 | 892.97 |
| 1929 | 1336.75 | 1176.47 | 2993.2 | 1608.12 | 1956.16 | 350.55 | 330.62 | 174.19 | 118.87 | 100.25 | 1034.06 | 639.51 | 984.9 |
| 1930 | 1084.82 | 1410.49 | 1257.46 | 546.25 | 527.88 | 134.76 | 59.79 | 46.6 | 58.94 | 46.51 | 61.07 | 121.65 | 446.35 |
| 1931 | 280.51 | 511.67 | 716.79 | 1083.97 | 494.28 | 126.12 | 117.84 | 129.69 | 69.27 | 36.08 | 44.25 | 1340.31 | 412.57 |
| 1932 | 1530.58 | 3176.29 | 767.3 | 1453.79 | 747.53 | 181.25 | 595.06 | 114.51 | 82.79 | 251.17 | 422.4 | 696.88 | 834.96 |
| 1933 | 2031.24 | 2289.83 | 1446.09 | 1305.13 | 1345.7 | 213.25 | 186.05 | 311.82 | 385.75 | 73.14 | 127.55 | 555.49 | 855.92 |
| 1934 | 784.02 | 314.98 | 2875.82 | 915.87 | 245.3 | 329.83 | 206.78 | 213.1 | 139.9 | 112.08 | 214.3 | 137.97 | 540.83 |
| 1935 | 1439.78 | 1149.87 | 2415.35 | 2363.34 | 791.6 | 704.81 | 270.16 | 197.75 | 177.9 | 36.46 | 183.2 | 266.88 | 833.09 |
| 1936 | 1065.3 | 646.68 | 1516.06 | 2173.05 | 172.71 | 60 | 197.62 | 56.98 | 38.95 | 100.78 | 346.01 | 532.44 | 575.55 |
| 1937 | 4458.56 | 1988.46 | 494.91 | 445.24 | 1309.71 | 415.99 | 137.83 | 137.59 | 125.42 | 209.44 | 112.7 | 496.69 | 861.05 |
| 1938 | 1209.68 | 1021.64 | 1313.27 | 879.9 | 480.2 | 605.66 | 355.21 | 584.24 | 174.39 | 51.32 | 260.19 | 300.01 | 602.98 |
| 1939 | 1196.62 | 3528 | 1649.97 | 1360.07 | 363.46 | 302.12 | 248.17 | 159.55 | 31.12 | 25.06 | 29.71 | 63.12 | 746.41 |
| 1940 | 104.18 | 775.93 | 1431.93 | 1850.99 | 533.37 | 317.8 | 242.36 | 101.55 | 97.26 | 25.52 | 63.91 | 157.06 | 475.16 |
| 1941 | 378.57 | 219.47 | 459.86 | 780.09 | 154.93 | 184.5 | 878.47 | 147.04 | 73.84 | 22.9 | 70.98 | 279.52 | 304.18 |
| 1942 | 509.65 | 984.82 | 1295.09 | 648.37 | 168.29 | 154.15 | 243.28 | 601.04 | 133.22 | 72.54 | 412.82 | 1248.69 | 539.33 |
| 1943 | 1361.8 | 1147.45 | 2144.78 | 1136.17 | 677.51 | 255.45 | 103.19 | 121.84 | 99.66 | 34.87 | 77.14 | 122.74 | 606.88 |
| 1944 | 547.39 | 1530.13 | 2274.68 | 1454.55 | 461.47 | 111.82 | 31.8 | 94.17 | 359.77 | -9999 | -9999 | -9999 | -9999 |
| |
|
|
|
|
|
|
|
|
|
|
|
|
|
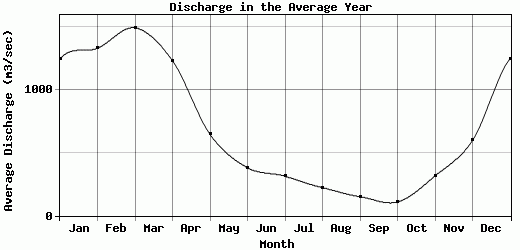
| Avg | 1247.09 | 1331.61 | 1494.37 | 1232.65 | 646.48 | 381.37 | 313.91 | 222.79 | 151.13 | 108.9 | 316.12 | 598.26 | 671.65 |
| |
|
|
|
|
|
|
|
|
|
|
|
|
|
| Std Dev | 931.67 |
852.23 |
754.67 |
542.22 |
439.58 |
397.87 |
361.67 |
191.25 |
121.61 |
87.2 |
306.41 |
593.03 |
196.74 |
| |
|
|
|
|
|
|
|
|
|
|
|
|
|
| | Jan | Feb | Mar | Apr | May | Jun | Jul | Aug | Sep | Oct | Nov | Dec | Avg Annual |
Click here for this table in tab-delimited format.
Tab-delimited format will open in most table browsing software, i.e. Excel, etc.
View this station on the map.
Return to start.