Results
| Country: | U.S.A.
| | Station: | GUNTERSVILLE AL | | River: | TENNESSEE RIVER | | Area: | 63036.86 | | Lat: | 34.37 | | Lon: | -86.29 | | Source: | USGS | | PointID: | 3573500 | | Area Units: | km2 | | Discharge Units: | m3/sec | | Starting Year: | 1930 | | Ending Year: | 1938 | | Total Years: | 9 | | Total Usable Years: | 8 | |
| |
| Year | Jan | Feb | Mar | Apr | May | Jun | Jul | Aug | Sep | Oct | Nov | Dec | Avg Annual |
|---|
| 1930 | -9999 | -9999 | -9999 | -9999 | 937.75 | 462.51 | 308.96 | 273.27 | 288.42 | 240.75 | 434.59 | 569.17 | -9999 |
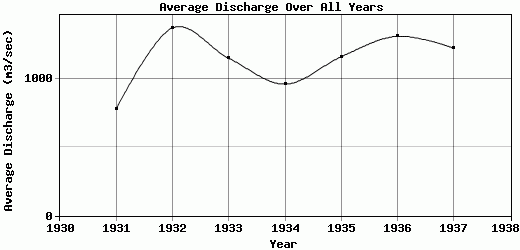
| 1931 | 839.01 | 823.32 | 814.52 | 2029.01 | 980.41 | 469.68 | 513.09 | 574.38 | 371.01 | 200.73 | 212.93 | 1546.22 | 781.19 |
| 1932 | 1575.61 | 3972.19 | 1499.7 | 1775.48 | 1405.98 | 664.32 | 835.35 | 440.83 | 257.47 | 716.42 | 950.13 | 2435.44 | 1377.41 |
| 1933 | 2848.23 | 3250.69 | 1826.99 | 1424.72 | 1537.06 | 566.43 | 463.67 | 510.89 | 544.82 | 274.41 | 255.16 | 345.68 | 1154.06 |
| 1934 | 1016.31 | 441.64 | 3403.98 | 1482.3 | 665.54 | 792.22 | 601.69 | 777.99 | 428.25 | 664.17 | 557 | 740.17 | 964.27 |
| 1935 | 1633.53 | 1461.87 | 3026.17 | 2812.07 | 1368.99 | 684.8 | 526.88 | 554.56 | 358.26 | 216.34 | 706.05 | 636.77 | 1165.52 |
| 1936 | 3093.59 | 2531.15 | 2036.08 | 3626.46 | 653.12 | 390.21 | 546.7 | 425.67 | 445.43 | 650.38 | 452.88 | 938.21 | 1315.82 |
| 1937 | 3832.66 | 2587.57 | 1413.57 | 992.23 | 1300.48 | 610.23 | 451.43 | 579.77 | 548.31 | 744.65 | 834.79 | 840.56 | 1228.02 |
| 1938 | 1268.33 | 1047.22 | 1729.62 | 2007.86 | 980.86 | 1271.91 | 1379.95 | 1233.07 | 575.87 | -9999 | -9999 | -9999 | -9999 |
| |
|
|
|
|
|
|
|
|
|
|
|
|
|
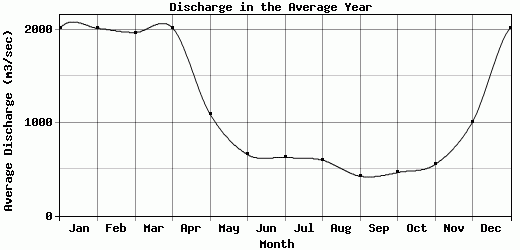
| Avg | 2013.41 | 2014.46 | 1968.83 | 2018.77 | 1092.24 | 656.92 | 625.3 | 596.71 | 424.2 | 463.48 | 550.44 | 1006.53 | 1140.9 |
| |
|
|
|
|
|
|
|
|
|
|
|
|
|
| Std Dev | 1027.01 |
1177.38 |
800.02 |
788.03 |
305.49 |
247.59 |
297.97 |
259.47 |
108.95 |
232.84 |
247.21 |
632.55 |
191.05 |
| |
|
|
|
|
|
|
|
|
|
|
|
|
|
| | Jan | Feb | Mar | Apr | May | Jun | Jul | Aug | Sep | Oct | Nov | Dec | Avg Annual |
Click here for this table in tab-delimited format.
Tab-delimited format will open in most table browsing software, i.e. Excel, etc.
View this station on the map.
Return to start.