Results
| Country: | U.S.A.
| | Station: | APPLETON, WI | | River: | FOX RIVER | | Area: | 10437609.68 | | Lat: | 44.24 | | Lon: | -88.42 | | Source: | USGS | | PointID: | 4084445 | | Area Units: | km2 | | Discharge Units: | m3/sec | | Starting Year: | 1986 | | Ending Year: | 1995 | | Total Years: | 10 | | Total Usable Years: | 9 | |
| |
| Year | Jan | Feb | Mar | Apr | May | Jun | Jul | Aug | Sep | Oct | Nov | Dec | Avg Annual |
|---|
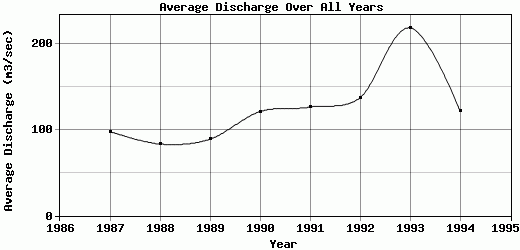
| 1986 | -9999 | -9999 | -9999 | -9999 | -9999 | -9999 | 132.28 | 109.71 | 251.99 | 382.55 | 163.7 | 111.11 | -9999 |
| 1987 | 157.85 | 153.53 | 101.89 | 117.62 | 116.89 | 72.22 | 45.75 | 47.34 | 53.79 | 55.04 | 109.55 | 143.95 | 97.95 |
| 1988 | 124.8 | 139.02 | 116.98 | 130.83 | 75.94 | 35.2 | 26.74 | 27.49 | 34.71 | 76.77 | 118.27 | 93.96 | 83.39 |
| 1989 | 80.29 | 87.68 | 127.01 | 123.25 | 87.74 | 220.99 | 51.14 | 46.83 | 36.49 | 52.24 | 82.77 | 71.96 | 89.03 |
| 1990 | 71.79 | 70.37 | 157.91 | 76.13 | 162.3 | 225.66 | 97.08 | 129.73 | 148.82 | 103.36 | 111.54 | 99.21 | 121.16 |
| 1991 | 99.68 | 87.75 | 147.91 | 230.96 | 167.67 | 112.96 | 63.39 | 67.42 | 60.62 | 82.91 | 205.26 | 190.71 | 126.44 |
| 1992 | 130.06 | 98.77 | 176.83 | 195.16 | 167.04 | 88.74 | 62.62 | 47.5 | 149.27 | 109.53 | 207.96 | 212.62 | 137.17 |
| 1993 | 146.06 | 123.59 | 139.57 | 337.55 | 336.96 | 376.62 | 427.85 | 177.25 | 154.05 | 128.77 | 156.32 | 119.74 | 218.69 |
| 1994 | 110.77 | 120.24 | 218.1 | 101.24 | 187.67 | 55.9 | 146.05 | 78.85 | 108.38 | 105.69 | 113.34 | 115.71 | 121.83 |
| 1995 | 101.95 | 65.48 | 85.63 | 137.74 | 150.78 | 113.23 | 46.36 | 172.15 | 96.32 | -9999 | -9999 | -9999 | -9999 |
| |
|
|
|
|
|
|
|
|
|
|
|
|
|
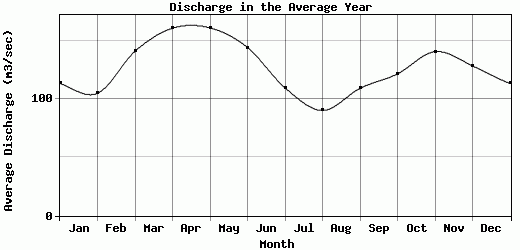
| Avg | 113.69 | 105.16 | 141.31 | 161.16 | 161.44 | 144.61 | 109.93 | 90.43 | 109.44 | 121.87 | 140.97 | 128.77 | 124.46 |
| |
|
|
|
|
|
|
|
|
|
|
|
|
|
| Std Dev | 27.09 |
28.84 |
37.91 |
76.57 |
71.81 |
103.51 |
112.24 |
51.34 |
64.81 |
95.23 |
42.02 |
43.43 |
39.86 |
| |
|
|
|
|
|
|
|
|
|
|
|
|
|
| | Jan | Feb | Mar | Apr | May | Jun | Jul | Aug | Sep | Oct | Nov | Dec | Avg Annual |
Click here for this table in tab-delimited format.
Tab-delimited format will open in most table browsing software, i.e. Excel, etc.
View this station on the map.
Return to start.