Results
| Country: | U.S.A.
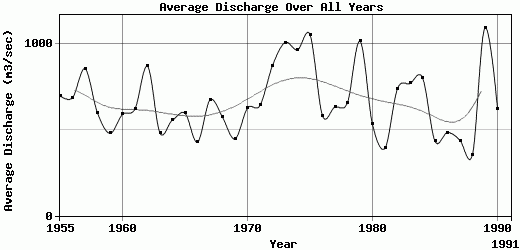
| | Station: | HEMPSTEAD, TX | | River: | BRAZOS RIVER | | Area: | 113642.46 | | Lat: | 30.12 | | Lon: | -96.19 | | Source: | USGS | | PointID: | 8111500 | | Area Units: | km2 | | Discharge Units: | m3/sec | | Starting Year: | 1955 | | Ending Year: | 1991 | | Total Years: | 37 | | Total Usable Years: | 36 | |
| |
| Year | Jan | Feb | Mar | Apr | May | Jun | Jul | Aug | Sep | Oct | Nov | Dec | Avg Annual |
|---|
| 1955 | 759.22 | 1288.83 | 1975.89 | 1699.02 | 568.46 | 479.4 | 149.71 | 158 | 241.85 | 246.9 | 384.78 | 417.21 | 697.44 |
| 1956 | 412.27 | 2236.16 | 1609.96 | 1380.55 | 571.93 | 266.95 | 162.43 | 198.05 | 206.18 | 167.06 | 240.91 | 776.63 | 685.76 |
| 1957 | 1304.77 | 2279.72 | 1194.43 | 1006.2 | 403.56 | 322.14 | 385.89 | 266.34 | 247.27 | 396.13 | 1111.38 | 1336.75 | 854.55 |
| 1958 | 1086.46 | 824.31 | 482.21 | 1051.13 | 1392.01 | 360.14 | 376.42 | 319.81 | 333.95 | 332.37 | 187.23 | 423.36 | 597.45 |
| 1959 | 522.85 | 641.02 | 503.77 | 723.5 | 318.16 | 336.38 | 169.27 | 341.55 | 243.19 | 298.54 | 542.46 | 1108.29 | 479.08 |
| 1960 | 1090.3 | 815.72 | 1205.03 | 721.33 | 378.81 | 457.06 | 563.6 | 460.49 | 363.57 | 235.61 | 318.45 | 457.18 | 588.93 |
| 1961 | 605.34 | 605.51 | 1595.8 | 1248.12 | 665.6 | 567.28 | 353.91 | 266.9 | 325.74 | 195.3 | 259.72 | 765.86 | 621.26 |
| 1962 | 1296.74 | 1482.7 | 2467.6 | 2325.3 | 695.15 | 398.84 | 286.93 | 227.12 | 191.58 | 305.33 | 340.13 | 407.89 | 868.78 |
| 1963 | 392.75 | 570.16 | 1878.42 | 786.23 | 323.44 | 326.98 | 386.09 | 414.07 | 193.74 | 132.73 | 189.65 | 174.58 | 480.74 |
| 1964 | 428.92 | 559.72 | 1315.19 | 1279.27 | 620.86 | 206.97 | 258.3 | 267.21 | 186.68 | 298 | 376.41 | 877.85 | 556.28 |
| 1965 | 1108.02 | 947.3 | 1288.88 | 1552.24 | 465.68 | 365.96 | 359.98 | 243 | 150.09 | 197.5 | 229.68 | 240.42 | 595.73 |
| 1966 | 329.24 | 557.76 | 355.49 | 385.07 | 582.05 | 298.39 | 212.8 | 312.57 | 310.49 | 367.25 | 518.78 | 900.36 | 427.52 |
| 1967 | 679.88 | 593.75 | 1335.92 | 493.25 | 1136.97 | 460.79 | 870.15 | 523.92 | 346.85 | 169.98 | 377.66 | 1085.91 | 672.92 |
| 1968 | 1348.99 | 642.89 | 955.38 | 1226.03 | 1280.29 | 498.91 | 127.53 | 185.74 | 112.04 | 107.49 | 171.38 | 214.69 | 572.61 |
| 1969 | 364.09 | 886.52 | 593.62 | 851.4 | 538.48 | 451.23 | 316.66 | 238.68 | 154.23 | 187.99 | 244.56 | 524.08 | 445.96 |
| 1970 | 1037.18 | 1093.04 | 761.82 | 1144.48 | 777.75 | 405.57 | 410.67 | 409.98 | 384.43 | 204.17 | 373.58 | 504.12 | 625.57 |
| 1971 | 887.85 | 1523.15 | 870.06 | 697.02 | 973.05 | 361.08 | 382.96 | 663.81 | 326.75 | 295.89 | 273.19 | 440.23 | 641.25 |
| 1972 | 1404.89 | 1332.27 | 1617.54 | 1247.27 | 802.24 | 238.62 | 320.41 | 464.41 | 349.91 | 312.64 | 615.95 | 1768.44 | 872.88 |
| 1973 | 1242.75 | 1318.26 | 1931.13 | 1432.93 | 1239.65 | 1155.52 | 852.07 | 501.93 | 230.37 | 271.21 | 645.82 | 1269.88 | 1007.63 |
| 1974 | 2883.95 | 2015.77 | 1207.03 | 1173.65 | 677.96 | 783.79 | 141.22 | 247.11 | 570.34 | 349.63 | 632.66 | 894.82 | 964.83 |
| 1975 | 1532.95 | 2028.71 | 2903.59 | 2125.1 | 891.89 | 376.22 | 154.57 | 149.44 | 196.41 | 676.37 | 770.51 | 828.59 | 1052.86 |
| 1976 | 1425.99 | 979.77 | 967.07 | 844.97 | 241.03 | 639.86 | 488.62 | 234.84 | 183.06 | 289.26 | 346.68 | 343.73 | 582.07 |
| 1977 | 632.25 | 412.11 | 960.68 | 1332.6 | 572.92 | 236.01 | 282.21 | 240.69 | 313.76 | 618.93 | 736.51 | 1246.4 | 632.09 |
| 1978 | 1355.29 | 1023.86 | 837.05 | 272.81 | 781.98 | 502.44 | 330.65 | 473.53 | 363.02 | 156.56 | 194.58 | 1605.3 | 658.09 |
| 1979 | 2009.78 | 1144.01 | 1295.55 | 1744.42 | 825.33 | 467.5 | 403.75 | 498.5 | 952.22 | 657.41 | 1073.21 | 1099.89 | 1014.3 |
| 1980 | 1047.18 | 654.15 | 1387.99 | 1195.83 | 517.68 | 333.64 | 409.61 | 261.09 | 178.94 | 167.86 | 107.43 | 111.74 | 531.09 |
| 1981 | 113.87 | 305.4 | 229.04 | 307.19 | 353.73 | 1013.56 | 437.45 | 333.81 | 335.14 | 372.54 | 331.28 | 590.62 | 393.64 |
| 1982 | 1366.34 | 1314.41 | 962.96 | 686.57 | 416.85 | 402.38 | 406.08 | 635.13 | 659.03 | 414.41 | 447.31 | 1157.53 | 739.08 |
| 1983 | 1056.86 | 916.26 | 530.09 | 803.78 | 1745.79 | 1301.54 | 503.31 | 470.61 | 296.01 | 178.63 | 387.11 | 1043.44 | 769.45 |
| 1984 | 567.98 | 615.32 | 1009.55 | 1196.39 | 2446.59 | 673.28 | 373.32 | 449.94 | 213.03 | 278.45 | 836.96 | 974.1 | 802.91 |
| 1985 | 913.08 | 1044.19 | 484.44 | 316.28 | 170.36 | 208.63 | 240.34 | 329.27 | 249.49 | 206.33 | 363.49 | 673.52 | 433.29 |
| 1986 | 309.75 | 678.71 | 518.16 | 226.5 | 248.92 | 380.96 | 215.81 | 264.12 | 338.26 | 211.27 | 1033.91 | 1376.21 | 483.55 |
| 1987 | 893.81 | 729.06 | 771.82 | 592.34 | 231.35 | 253.44 | 462.61 | 293.75 | 180.31 | 181.29 | 173.29 | 482.01 | 437.09 |
| 1988 | 659.4 | 535.24 | 440.08 | 402.15 | 148.88 | 153.06 | 213.62 | 167.29 | 146.79 | 113.74 | 439.91 | 839.74 | 354.99 |
| 1989 | 1442.98 | 1780.13 | 2011.88 | 959.47 | 549.68 | 1268.04 | 1057.5 | 486.88 | 573.76 | 1094.41 | 981.47 | 908.52 | 1092.89 |
| 1990 | 950.63 | 1922.72 | 848.14 | 379.42 | 490.85 | 258.59 | 265.97 | 291.71 | 187.94 | 229.46 | 258.77 | 1395.54 | 623.31 |
| 1991 | -9999 | -9999 | -9999 | -9999 | -9999 | -9999 | -9999 | -9999 | -9999 | -9999 | -9999 | -9999 | -9999 |
| |
|
|
|
|
|
|
|
|
|
|
|
|
|
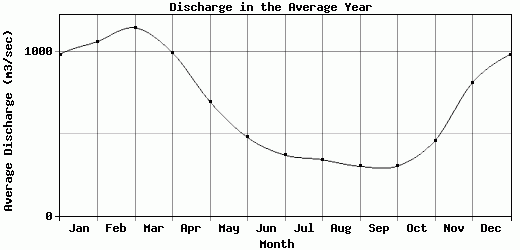
| Avg | 985.13 | 1063.85 | 1147.31 | 994.72 | 695.72 | 478.09 | 370.35 | 341.42 | 301.01 | 303.3 | 458.8 | 812.93 | 662.72 |
| |
|
|
|
|
|
|
|
|
|
|
|
|
|
| Std Dev | 532.68 |
533.05 |
607.33 |
507.95 |
463.7 |
285.02 |
201.96 |
131.76 |
163.74 |
190.91 |
273.46 |
416.43 |
194.98 |
| |
|
|
|
|
|
|
|
|
|
|
|
|
|
| | Jan | Feb | Mar | Apr | May | Jun | Jul | Aug | Sep | Oct | Nov | Dec | Avg Annual |
Click here for this table in tab-delimited format.
Tab-delimited format will open in most table browsing software, i.e. Excel, etc.
View this station on the map.
Return to start.