Results
| Country: | U.S.A.
| | Station: | HIGHBANK, TX | | River: | BRAZOS RIVER | | Area: | 78824.57 | | Lat: | 31.13 | | Lon: | -96.82 | | Source: | USGS | | PointID: | 8098290 | | Area Units: | km2 | | Discharge Units: | m3/sec | | Starting Year: | 1950 | | Ending Year: | 1969 | | Total Years: | 20 | | Total Usable Years: | 19 | |
| |
| Year | Jan | Feb | Mar | Apr | May | Jun | Jul | Aug | Sep | Oct | Nov | Dec | Avg Annual |
|---|
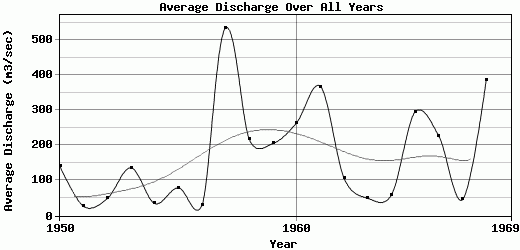
| 1950 | 134.44 | 395.37 | 88.29 | 231.9 | 165.34 | 320.77 | 58.2 | 73.61 | 101.29 | 68.6 | 27.44 | 22.9 | 140.68 |
| 1951 | 25.86 | 35.81 | 25.93 | 29.84 | 12.89 | 91.48 | 7.15 | 4.43 | 30.02 | 21.7 | 16.19 | 17 | 26.53 |
| 1952 | 14.23 | 27.99 | 37.34 | 146.05 | 140.48 | 88.88 | 8.94 | 0.03 | 1.09 | 1.73 | 10.11 | 106.33 | 48.6 |
| 1953 | 129.05 | 61.52 | 114.04 | 24.83 | 770.87 | 36.3 | 7.39 | 12.87 | 51.43 | 85.62 | 108.16 | 236.38 | 136.54 |
| 1954 | 66.61 | 26.28 | 8.01 | 8.17 | 179.88 | 60.85 | 4.84 | 8.19 | 4.99 | 15.4 | 23.09 | 12.04 | 34.86 |
| 1955 | 15.27 | 132.55 | 25.88 | 118.44 | 104.96 | 139.16 | 30 | 25.01 | 18.78 | 297.53 | 27.68 | 18.1 | 79.45 |
| 1956 | 25.45 | 60.8 | 26.03 | 15.29 | 134.21 | 6.98 | 3.09 | 3.9 | 12.15 | 16.59 | 33.12 | 27.36 | 30.41 |
| 1957 | 16.32 | 23.4 | 110.15 | 505.89 | 2186.35 | 1517.32 | 399.52 | 79.69 | 39.43 | 811.58 | 514.37 | 223.09 | 535.59 |
| 1958 | 267.75 | 396.74 | 396.68 | 154.22 | 744.48 | 107.98 | 154.45 | 37.21 | 136.42 | 108.09 | 57.76 | 43.98 | 217.15 |
| 1959 | 36.16 | 170.67 | 57.39 | 414.48 | 219.73 | 131.09 | 98.76 | 53.54 | 32.2 | 660.55 | 308.89 | 290.47 | 206.16 |
| 1960 | 458.83 | 365.06 | 182.76 | 90.42 | 208.39 | 229.39 | 139.24 | 42 | 29.84 | 223.18 | 490.28 | 726.27 | 265.47 |
| 1961 | 1019.87 | 978.15 | 386.63 | 151.8 | 60.68 | 428.03 | 420.9 | 127.22 | 365.24 | 148.52 | 150.83 | 179.97 | 368.15 |
| 1962 | 111.28 | 112.6 | 64.37 | 41.12 | 69.51 | 114.44 | 63.86 | 99.91 | 195.12 | 130.51 | 67.33 | 203.78 | 106.15 |
| 1963 | 120.19 | 124.77 | 55.82 | 70.99 | 17.19 | 78.02 | 39.48 | 4.56 | 10.05 | 19.29 | 26.89 | 28.13 | 49.61 |
| 1964 | 23.58 | 60.21 | 99.79 | 37.96 | 59.74 | 52.6 | 24.39 | 8.91 | 69.81 | 82.18 | 117.69 | 77.45 | 59.53 |
| 1965 | 214.44 | 514.13 | 164.3 | 192.83 | 1165.25 | 535.83 | 133.67 | 89.43 | 42.23 | 56.05 | 194.61 | 243.86 | 295.55 |
| 1966 | 112.79 | 230.16 | 195.83 | 331.71 | 1051.99 | 138.22 | 29.84 | 84.12 | 313.6 | 148.76 | 43.84 | 38.27 | 226.59 |
| 1967 | 31.57 | 23.47 | 9.14 | 40.29 | 59.33 | 60.51 | 28.17 | 27.77 | 31.83 | 29.43 | 132.61 | 77.85 | 46 |
| 1968 | 508.74 | 353.58 | 431.05 | 476.39 | 1021.17 | 796.27 | 483.52 | 70.43 | 102.35 | 79.89 | 73.99 | 246.76 | 387.01 |
| 1969 | -9999 | -9999 | -9999 | -9999 | -9999 | -9999 | -9999 | -9999 | -9999 | -9999 | -9999 | -9999 | -9999 |
| |
|
|
|
|
|
|
|
|
|
|
|
|
|
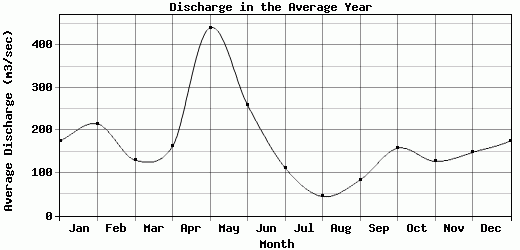
| Avg | 175.39 | 215.43 | 130.5 | 162.24 | 440.65 | 259.69 | 112.39 | 44.89 | 83.57 | 158.17 | 127.63 | 148.42 | 171.58 |
| |
|
|
|
|
|
|
|
|
|
|
|
|
|
| Std Dev | 243.47 |
235.55 |
130.75 |
155.17 |
560.21 |
355.04 |
147.59 |
38.02 |
100.47 |
212.93 |
147.64 |
165.88 |
141.6 |
| |
|
|
|
|
|
|
|
|
|
|
|
|
|
| | Jan | Feb | Mar | Apr | May | Jun | Jul | Aug | Sep | Oct | Nov | Dec | Avg Annual |
Click here for this table in tab-delimited format.
Tab-delimited format will open in most table browsing software, i.e. Excel, etc.
View this station on the map.
Return to start.