Results
| Country: | U.S.A.
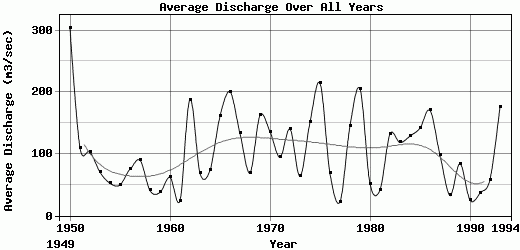
| | Station: | DRAYTON, ND | | River: | RED RIVER OF THE NORTH AT | | Area: | 23361220.78 | | Lat: | 48.57 | | Lon: | -97.14 | | Source: | USGS | | PointID: | 5092000 | | Area Units: | km2 | | Discharge Units: | m3/sec | | Starting Year: | 1949 | | Ending Year: | 1994 | | Total Years: | 46 | | Total Usable Years: | 45 | |
| |
| Year | Jan | Feb | Mar | Apr | May | Jun | Jul | Aug | Sep | Oct | Nov | Dec | Avg Annual |
|---|
| 1949 | -9999 | -9999 | -9999 | 323.88 | 84.3 | 154.6 | 96.97 | 92.46 | 49.18 | 31.85 | 36.32 | 30.28 | -9999 |
| 1950 | 22.6 | 20.66 | 27.71 | 881.22 | 1667.69 | 434.85 | 239.63 | 94.14 | 65.13 | 83.64 | 56.26 | 57 | 304.21 |
| 1951 | 55.9 | 51.83 | 64.58 | 486.3 | 255.47 | 126.45 | 69.12 | 35.26 | 48.44 | 38.5 | 36.39 | 49.33 | 109.8 |
| 1952 | 46.4 | 53.12 | 56.31 | 469.68 | 185.03 | 100.77 | 160.72 | 60.06 | 37.43 | 25.67 | 23 | 19.69 | 103.16 |
| 1953 | 16.98 | 17.54 | 47.27 | 103.17 | 86.89 | 250.3 | 148.28 | 63.11 | 37.38 | 24.47 | 26.28 | 25.32 | 70.58 |
| 1954 | 22.93 | 23.94 | 45.22 | 154.96 | 109.37 | 104.57 | 63.36 | 27.79 | 19.58 | 18.64 | 20.69 | 19.35 | 52.53 |
| 1955 | 20.46 | 18.48 | 18.72 | 205.94 | 59.02 | 85.4 | 64.3 | 47.68 | 24.43 | 24.05 | 17.19 | 12.2 | 49.82 |
| 1956 | 11.99 | 12.77 | 14.83 | 309.46 | 233.13 | 112.21 | 70.87 | 25.71 | 45.77 | 16.97 | 30.58 | 15.94 | 75.02 |
| 1957 | 12.49 | 12.09 | 37.38 | 137.51 | 105.57 | 108.55 | 194.34 | 74.03 | 152.69 | 102.65 | 94.13 | 46.22 | 89.8 |
| 1958 | 38.41 | 36.41 | 53.62 | 84.55 | 43.23 | 41.79 | 112.98 | 27.66 | 13.59 | 11.78 | 14.11 | 10.26 | 40.7 |
| 1959 | 10.43 | 10.84 | 21.97 | 141.72 | 50.09 | 73.25 | 60.36 | 21.99 | 15.51 | 15.5 | 15.58 | 13.17 | 37.53 |
| 1960 | 16.22 | 15.96 | 15.43 | 381.95 | 106.98 | 79.5 | 60.91 | 15.96 | 19.37 | 9.77 | 13.87 | 10.09 | 62.17 |
| 1961 | 9.55 | 9.53 | 47.21 | 59.37 | 67.26 | 30.01 | 13.37 | 7.38 | 10.43 | 18.78 | 11.96 | 6.83 | 24.31 |
| 1962 | 5.68 | 5.75 | 7.92 | 398.99 | 280.95 | 663.18 | 423.84 | 197.84 | 95.99 | 67.38 | 59.87 | 45.36 | 187.73 |
| 1963 | 38.04 | 31.72 | 49.36 | 182.08 | 99.42 | 184.36 | 80.71 | 33.19 | 33.9 | 40.62 | 29.02 | 22.31 | 68.73 |
| 1964 | 21.92 | 21.62 | 19.68 | 214.27 | 133.08 | 211.89 | 91.38 | 36.83 | 19.67 | 50.12 | 37.18 | 23.88 | 73.46 |
| 1965 | 25.06 | 24.72 | 27.96 | 716.75 | 369.09 | 259.9 | 142.55 | 57.83 | 54.22 | 116.05 | 70.71 | 63.93 | 160.73 |
| 1966 | 58.47 | 51.7 | 216.99 | 1087.18 | 407.66 | 166.92 | 101.39 | 99.45 | 68.85 | 52.3 | 48.97 | 44.62 | 200.38 |
| 1967 | 48.41 | 43.89 | 62.66 | 643.08 | 411.19 | 169.69 | 92.82 | 37.24 | 24.81 | 23.8 | 20.52 | 18.67 | 133.07 |
| 1968 | 14.85 | 15.16 | 48.5 | 100 | 61.87 | 158.4 | 162.52 | 72.78 | 53.78 | 45.3 | 52.82 | 47.01 | 69.42 |
| 1969 | 43.2 | 44.62 | 60.96 | 778.2 | 530.42 | 143.29 | 100.46 | 47.17 | 41.65 | 55.74 | 54.49 | 48.89 | 162.42 |
| 1970 | 39.11 | 39.66 | 43.72 | 490.89 | 394.75 | 353.07 | 105.55 | 32.03 | 34.01 | 31.29 | 38.43 | 31.05 | 136.13 |
| 1971 | 30.16 | 32.02 | 74.76 | 315.09 | 98.54 | 68.78 | 69.98 | 32.15 | 40.01 | 126.37 | 160.09 | 86.98 | 94.58 |
| 1972 | 52.7 | 41.04 | 205.48 | 629.49 | 259.69 | 172.13 | 67.83 | 69.07 | 58.87 | 50.25 | 41.71 | 32.53 | 140.07 |
| 1973 | 31.88 | 33.89 | 172.9 | 69.37 | 44.61 | 33.98 | 16.39 | 22.71 | 85.19 | 124.93 | 76.65 | 57.04 | 64.13 |
| 1974 | 49.39 | 47.34 | 57.09 | 536.49 | 517.1 | 216.15 | 93.37 | 91.51 | 55.7 | 55.24 | 58.87 | 36.35 | 151.22 |
| 1975 | 37.63 | 40.62 | 47.75 | 461.03 | 648.28 | 169.07 | 799.64 | 113.34 | 70.19 | 66.94 | 72.87 | 48.81 | 214.68 |
| 1976 | 46.17 | 48.95 | 93.39 | 376.68 | 85.42 | 54.21 | 38.47 | 32.93 | 20.19 | 10.62 | 7.83 | 4.23 | 68.26 |
| 1977 | 5.59 | 5.7 | 12.14 | 50.79 | 26.56 | 19.15 | 18.08 | 6.89 | 14.75 | 36.45 | 31.74 | 41.04 | 22.41 |
| 1978 | 38.02 | 31.84 | 61.48 | 1040.46 | 210.32 | 107.54 | 105.07 | 43.53 | 30.4 | 27.92 | 23.04 | 22.57 | 145.18 |
| 1979 | 20.53 | 20.48 | 24.91 | 828.56 | 908.61 | 188.4 | 177.48 | 94.61 | 59.38 | 47.03 | 50.97 | 42.23 | 205.27 |
| 1980 | 39.3 | 41.42 | 46.83 | 284.32 | 58.67 | 43.37 | 21.47 | 13.84 | 23.96 | 15.75 | 18.42 | 11.64 | 51.58 |
| 1981 | 8.61 | 9.62 | 34.9 | 36.09 | 38.66 | 37.12 | 78.28 | 42.73 | 53.71 | 72.81 | 53.9 | 33.6 | 41.67 |
| 1982 | 31.5 | 29.47 | 55.12 | 669.81 | 221.03 | 104.91 | 120.24 | 64.9 | 35.76 | 120.96 | 69.58 | 59.85 | 131.93 |
| 1983 | 45.5 | 41.66 | 264.17 | 309.93 | 95.93 | 145.03 | 185.48 | 81.72 | 83.29 | 62.14 | 56.01 | 51.11 | 118.5 |
| 1984 | 44.77 | 44.8 | 125.8 | 544.89 | 120.24 | 337.41 | 94.31 | 40.84 | 27.62 | 62.53 | 60.94 | 43.61 | 128.98 |
| 1985 | 37.54 | 37.47 | 182.4 | 162.84 | 261.88 | 233.66 | 197.15 | 205.22 | 139.02 | 108.88 | 68.74 | 65.49 | 141.69 |
| 1986 | 55.99 | 47.59 | 150.39 | 612.59 | 477.33 | 182.27 | 134.89 | 76.89 | 84.74 | 99.01 | 57.69 | 66.24 | 170.47 |
| 1987 | 52.24 | 47.38 | 220.2 | 429.64 | 97.04 | 84.49 | 81.12 | 70.86 | 31.04 | 21.62 | 21.73 | 19.7 | 98.09 |
| 1988 | 13.07 | 14.53 | 68.5 | 176.99 | 40.4 | 26.8 | 9.85 | 7.77 | 9.31 | 9.91 | 9.41 | 7.67 | 32.85 |
| 1989 | 7.63 | 10.09 | 12.03 | 676.84 | 129.58 | 64.89 | 32.43 | 12.78 | 29.69 | 13.43 | 12.77 | 8.07 | 84.19 |
| 1990 | 4.94 | 7.13 | 31.62 | 80.66 | 42.83 | 56.31 | 31.4 | 12.31 | 10.32 | 8.97 | 9.53 | 6.94 | 25.25 |
| 1991 | 5.3 | 8.2 | 19.26 | 53.62 | 77.76 | 58.21 | 90.01 | 31.26 | 39.78 | 22.44 | 16.82 | 14.77 | 36.45 |
| 1992 | 14.74 | 14.17 | 138.37 | 119.08 | 75.23 | 61.62 | 84.49 | 44.06 | 72.4 | 32.33 | 20.65 | 23.25 | 58.37 |
| 1993 | 23.02 | 28.26 | 44.5 | 424.65 | 110.86 | 129.82 | 304.76 | 611.01 | 224.03 | 107.6 | 57.46 | 52.62 | 176.55 |
| 1994 | 43.57 | 42.13 | 210.47 | 440.21 | 193.53 | 171.87 | 394.24 | 112.88 | 119.23 | -9999 | -9999 | -9999 | -9999 |
| |
|
|
|
|
|
|
|
|
|
|
|
|
|
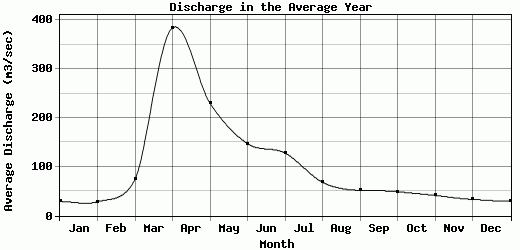
| Avg | 29.31 | 28.62 | 74.28 | 384.38 | 230.06 | 147.39 | 128.32 | 68.33 | 51.83 | 49.09 | 41.46 | 33.28 | 104.87 |
| |
|
|
|
|
|
|
|
|
|
|
|
|
|
| Std Dev | 16.36 |
14.95 |
66.53 |
272.92 |
283.25 |
117.91 |
132.74 |
91.3 |
41.17 |
35.32 |
28.23 |
19.96 |
61.71 |
| |
|
|
|
|
|
|
|
|
|
|
|
|
|
| | Jan | Feb | Mar | Apr | May | Jun | Jul | Aug | Sep | Oct | Nov | Dec | Avg Annual |
Click here for this table in tab-delimited format.
Tab-delimited format will open in most table browsing software, i.e. Excel, etc.
View this station on the map.
Return to start.